Maker Pro
Maker Pro

IR IMAGING DEVICE on the cheap

Thanks for the reference. The materials this article suggests to use as an IR filter may impede the transmission of IR energy so as to make realtime observation impractical with the suggested design. Perhaps polarized sunglasses lens, one turned perpendicular, may offer enough blocking of visible light but readily pass infrared.
 
It's a common technique to apply isopropyl alcohol while briefly applying power.

Look at 2 min into this youtube video.

Interesting video. However, I believe I did hear mention of a fireball. Not a desired side effect. When the person in the video was desoldering the shorted capacitor, he was heat sinking the heat gun energy by grasping the component with tweezers prior to the solder becoming molten resulting in having to apply so much heat as to ignite the bubble of alcohol fumes. Maybe methyline chloride (dimethyl chloride) could be substituted for the alcohol. Please check flammability before trying it though. Seems like boiling point was around 75º Celsius.
 
I use the technique to find the location of a short by briefly applying power with current limited, and increasing until the location is evident.
It is not wise to try to solder with power supplied or before the alcohol has evaporated.
 
The device in a following photo was inline with what I refer to as the objective lens. It resides between the objective lens and the sensor plate of a security camera that I have disassembled. I will apply power to this component's leads and make an observation of the translucent film which it holds. This particular security camera would change display image from a color image to a black and white image when ambient light fell to a certain level. At the same time, an array of IR LEDs would illuminate. My immediate quandary concerns the voltage that this device desires. 5 volts? 12 volts? I was going to power up the main section of the camera's electronics and take a reading at the leads 2 pin plug, but I packed that section away during my move and have yet to find it. Maybe I'll apply 5 volts to begin with and see if I detect any action.DSCF2541 (2).JPG DSCF2540 (2).JPG THRU PIC ÷ 10 1.1.jpgThird photo is looking though inactivated filter film.
 
I did IR camera using camera film as filter layer. Just make sure you have good camera to start and it works good on some applications at least. I used it only for IR led and looking at the environment to see Sun's infrared.
 
Alrighty. Making a visible light filter should probably be my next task. With too much ambient light, the photo sensor circuits emulates an iris contraction. I may have an end piece from a color negative. Usually not opaque but a darkish redish color. DSCF2558 (2).JPG
 
Nice, I never tested mine to see if it worked with heat sources like that. I used PlayStation 3 "eye" camera with computer. Had to remove the IR filter on the lenses and add that film layer which made image on my camera completely black and whitish if I remember correctly.

Since I used it mostly to detect IR leds, resolution and speed was the key which the Ps3 camera provided over 100fps if I remember correctly.
 
Well, as far as my analysis of what I have come up with, my security camera modification has landed me in the high frequency end of the near infrared spectrum. I'll guess right around 0.0077μm wavelength. This maybe hasn't left me totally SOL, but it would be nice if I could see lower temperatures. Right now I don't believe that the photo sensor will sense anything cooler than approximately 220º F. That is to be expected though since this camera is designed to sense reflected IR from its IR LED array. I'll see if it picks up any hot spots, in time to be useful, on future unproved circuits. The following photos are of a hoody hanging over a door window. One with visible light, the other with IR filter removed.DSCF2565 (2).JPG DSCF2570 (2).JPG
 

hevans1944

Hop - AC8NS
...my security camera modification has landed me in the high frequency end of the near infrared spectrum. I'll guess right around 0.0077μm wavelength.
The silicon camera sensor (probably a CCD) will have it's peak sensitivity at about 0.9μm or 900nm wavelength. This IS close to the high frequency end of the near-infrared spectrum, if we define that as the lower wavelength limit of human visual perception. This varies from person to person, probably a result of genetic selection. I can, for example, dimly see some infrared LEDs that to most people appear unlit. This may perhaps have been an advantage to hunting at night or exploring caves, but I have yet to find it useful in my daily life.

As for temperature versus wavelength... there is no such thing. At ANY given temperature, a body (blackbody or graybody or anything in between) emits a radiation spectrum that is continuous with a PEAK intensity that is a function of wavelength. Well, actually, the emission wavelengths are quantized into discrete wavelengths but the separation is so close that is appears to be continuous. It so happens that things at room temperature, or about 300K, have their peak emission at about 9.66μm, which happens to be quite close to a CO2 laser wavelength of 10.6μm and smack dab in the middle of an mid-infrared atmospheric transmission window (one of two) that extend from 8μm to 14μm. There is another transmission window that extends from 3μm to 5μm. Both windows are useful for FLIR (Forward Looking Infra-Red) imaging.

maxresdefault.jpg


As the temperature increases the peak of the emission wavelength moves to shorter wavelengths:

fig5bb.png

The graph above shows peak wavelengths in the infrared for 300K, 400K, and 500K. At higher temperatures the whole ensemble shifts to shorter wavelengths with higher energy peaks that increase as the fourth power of temperature, always with a sharp fall-off at shorter wavelengths and a very long tail at longer wavelengths. In this graph the visible spectrum doesn't appear at all because it requires some pretty HOT temperatures to produce visible light... well, visible to the unaided human eye or most silicon sensors, but the radiation is nevertheless still present even if your eye or camera cannot "see" it. So, at 900nm or 0.9μm there is more than enough near-infrared energy coming through your window to "white out" the image.

The graph below shows the emission for wavelengths in the visible as a function of wavelength. Although the intensity scale is in arbitrary units on this graph, note that the curves for lower temperatures are entirely contained under the curves for higher temperatures. This is true across the entire electromagnetic spectrum, but note also the considerably lower intensities at longer wavelengths for any arbitrary temperature. That fact that the peak of the emission spectrum occurs near 10μm for objects near room temperature (roughly 300K) means there is almost no energy emitted at shorter wavelengths, in particular at the silicon detector peak sensitivity occurring at 0.9μm.
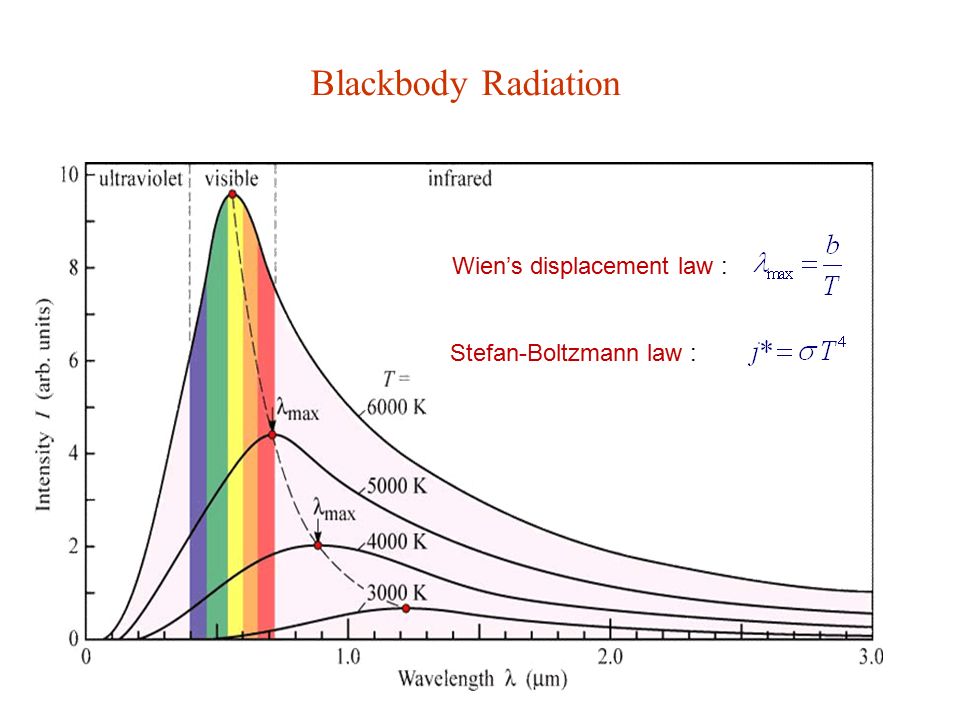
Blackbody+Radiation+Wien%E2%80%99s+displacement+law+%3A+Stefan-Boltzmann+law+%3A.jpg

This rabbit hole is quite deep and becomes much more complicated when you consider reflectance, absorptance, transmittance, emmitance and scattering from real (not perfect blackbody) objects as functions of surface roughness, emissivity, wavelength and temperature. All of this didn't really become vitally important until the development of hyperspectral imaging sensors complicated the hell out of what an "image" represented.
 
The device in a following photo was inline with what I refer to as the objective lens. It resides between the objective lens and the sensor plate of a security camera that I have disassembled. I will apply power to this component's leads and make an observation of the translucent film which it holds. This particular security camera would change display image from a color image to a black and white image when ambient light fell to a certain level. At the same time, an array of IR LEDs would illuminate. My immediate quandary concerns the voltage that this device desires. 5 volts? 12 volts? I was going to power up the main section of the camera's electronics and take a reading at the leads 2 pin plug, but I packed that section away during my move and have yet to find it. Maybe I'll apply 5 volts to begin with and see if I detect any action.View attachment 47661 View attachment 47662 View attachment 47663Third photo is looking though inactivated filter film.
The IR filter device is changed from IR filter to no IR filter by changing the polarity of the input current. I found it handy to use 2 alkaline batteries in series (3V). I used no current limiter with these but did when using 5 volts. Seems like I used a 220Ω resister and only energized circuit long enough for unit to flip.
 
The silicon camera sensor (probably a CCD) will have it's peak sensitivity at about 0.9μm or 900nm wavelength. This IS close to the high frequency end of the near-infrared spectrum, if we define that as the lower wavelength limit of human visual perception. This varies from person to person, probably a result of genetic selection. I can, for example, dimly see some infrared LEDs that to most people appear unlit. This may perhaps have been an advantage to hunting at night or exploring caves, but I have yet to find it useful in my daily life.

As for temperature versus wavelength... there is no such thing. At ANY given temperature, a body (blackbody or graybody or anything in between) emits a radiation spectrum that is continuous with a PEAK intensity that is a function of wavelength. Well, actually, the emission wavelengths are quantized into discrete wavelengths but the separation is so close that is appears to be continuous. It so happens that things at room temperature, or about 300K, have their peak emission at about 9.66μm, which happens to be quite close to a CO2 laser wavelength of 10.6μm and smack dab in the middle of an mid-infrared atmospheric transmission window (one of two) that extend from 8μm to 14μm. There is another transmission window that extends from 3μm to 5μm. Both windows are useful for FLIR (Forward Looking Infra-Red) imaging.

maxresdefault.jpg


As the temperature increases the peak of the emission wavelength moves to shorter wavelengths:

fig5bb.png

The graph above shows peak wavelengths in the infrared for 300K, 400K, and 500K. At higher temperatures the whole ensemble shifts to shorter wavelengths with higher energy peaks that increase as the fourth power of temperature, always with a sharp fall-off at shorter wavelengths and a very long tail at longer wavelengths. In this graph the visible spectrum doesn't appear at all because it requires some pretty HOT temperatures to produce visible light... well, visible to the unaided human eye or most silicon sensors, but the radiation is nevertheless still present even if your eye or camera cannot "see" it. So, at 900nm or 0.9μm there is more than enough near-infrared energy coming through your window to "white out" the image.

The graph below shows the emission for wavelengths in the visible as a function of wavelength. Although the intensity scale is in arbitrary units on this graph, note that the curves for lower temperatures are entirely contained under the curves for higher temperatures. This is true across the entire electromagnetic spectrum, but note also the considerably lower intensities at longer wavelengths for any arbitrary temperature. That fact that the peak of the emission spectrum occurs near 10μm for objects near room temperature (roughly 300K) means there is almost no energy emitted at shorter wavelengths, in particular at the silicon detector peak sensitivity occurring at 0.9μm.

Blackbody+Radiation+Wien%E2%80%99s+displacement+law+%3A+Stefan-Boltzmann+law+%3A.jpg

This rabbit hole is quite deep and becomes much more complicated when you consider reflectance, absorptance, transmittance, emmitance and scattering from real (not perfect blackbody) objects as functions of surface roughness, emissivity, wavelength and temperature. All of this didn't really become vitally important until the development of hyperspectral imaging sensors complicated the hell out of what an "image" represented.
I have been studying these graphs but have yet to understand them well enough to have an intuitive grasp upon various situations. I will keep at it though. Thanks for displaying them. I will "snip" these and put in my IR project file. At one particular job I had, I took readings using an IR absorption spectrometer. The readings were plugged into a formula and the result was concentration of hydrocarbons in ppm.
 
Top