Learn to make a Pi-powered touch display that shows updated temperature and humidity live from a mySQL database!
Required Hardware
- Raspberry Pi 3 Model B+
- 7” display
Required Software
- A server running LAMPs, with data you want to display
- NOOBs installed on the Raspberry Pi with the display
Setting Up the Server Side
We’ll be using the database from the previous project. Our display stand is going to connect to the database, get the last reading, and display it with a Google Gauge chart.
All of this will end up in a device that, when power is applied, boots up, starts a web-browser, and displays the page with gauge charts.
To connect to the database we’re using this little code snippet:
<?php

# Assigning the values to usable variables
$db_host = "localhost";
$db_name = "db_Kajsa";
$db_table = "tbl_temperature";
$db_user = "my_username";
$db_password = "my_password";

# Prepare a connection to the mySQL database
$connection = new mysqli($db_host, $db_user, $db_password, $db_name);
?>
To get the page to refresh every 10 seconds, we’re using a meta-tag. This is located in the head-section of our *.PHP-file.
<meta http-equiv="refresh" content="10; URL='http://my_domain.com/gauge_01.php'" />
Then all the necessary libraries from Google are loaded, and the page extracts the data from the database and formats it in the way that Google Gauge Chart needs it (which isn’t very different from the other Google Charts).
To get the data and arrange it in the proper format, we’ll run this while-loop:
<?php
# This query connects to the database and get the last temperature reading
$sql = "SELECT temperature FROM tbl_temperature ORDER BY id DESC LIMIT 1";
$result = $connection->query($sql);
# This while - loop formats and put all the retrieved
# data into [temperature', 'value'] way.
while ($row = $result->fetch_assoc()) {
  echo "['Temp',".$row['temperature']."],";
  } // End while
?>
To format the charts as I want them, I use the Options-block to the gauge chart:
// Options for the temperature gauge
  var temp_options = {
    width: 300, height: 240,      // Gauge dimensions
    redFrom: 35, redTo: 40,       // Start and stop for the red part
    yellowFrom:25, yellowTo: 35,  // Start and stop for the yellow part
    greenFrom: 15, greenTo: 25,   // Start and stop for the green part
    minorTicks: 5,                // The minimum value of a gauge
    max: 40,                      // Max value
  };
This needs to be done for both of the charts.
Next we’ll have to display them on a page. I want them to be in the center of the screen, so I’ll add some CSS to the head-block as well:
<style>
  .green-square {
    border: 3px;
    border-color: green;
    border-style: solid;
    width: 500px;
    height: 240px;
    position: absolute;
    left: 50%;
    top: 50%;
    transform: translate(-50%, -50%);
  }
</style>
The above code draws a green rectangle in the center of the screen, regardless of the screen size and resolution.
The last block in this PHP-file is the body-block:
<body>
    <div class="green-square">
      <div style="float:left;" id="temp_chart_div"></div>
      <div style="float:right;" id="hum_chart_div"></div>
    </div>
  </body>
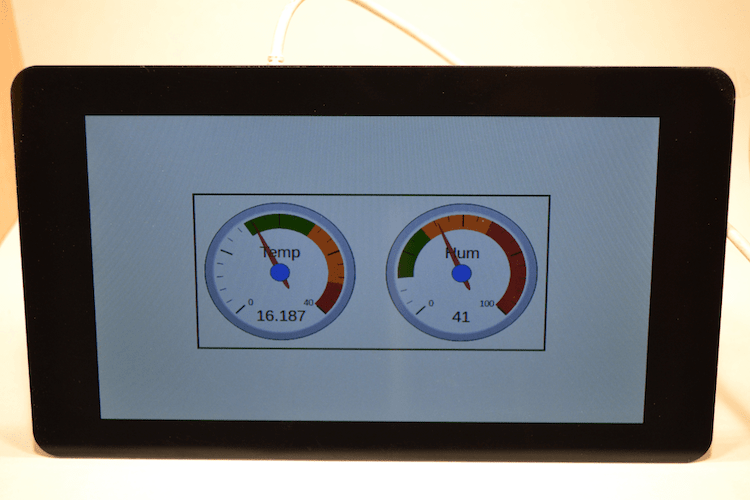
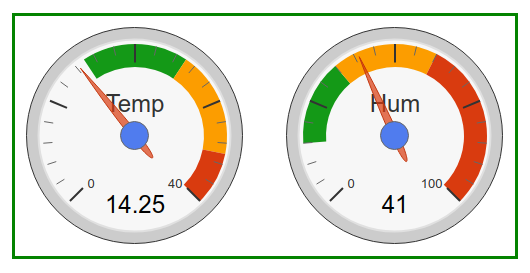
If everything has gone as planned, this is what you’ll have in the center of the display’s screen when you open the page in a web browser:
This file is on the server, along with the mySQL database.
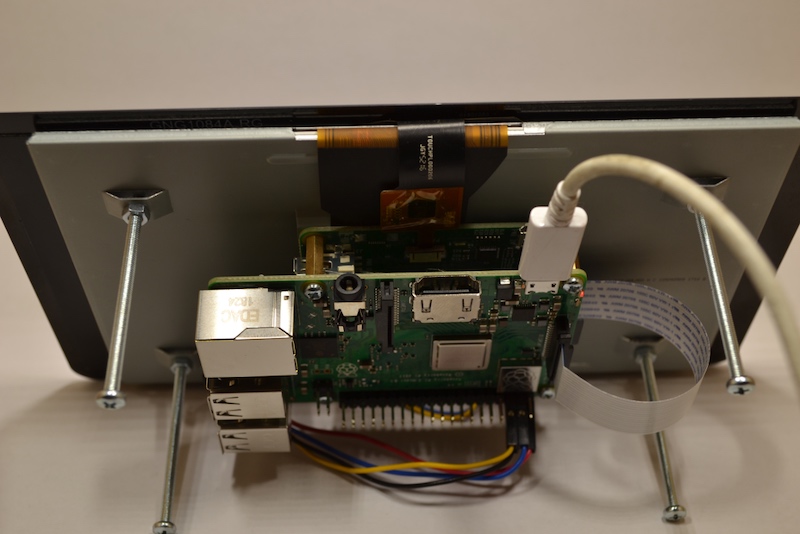
Setting Up the Client Side
The client, which in my case is a Raspberry Pi with a 7” display, has NOOBS installed. To get the display to work on the Pi, please follow the Raspberry Pi Documentation.
I’ve configured the Raspberry Pi to auto login as Pi, hide the mouse, disable the screensaver, open Chromium in fullscreen, and load the page. All except the autologin part is done in one file, called autostart.
That file is located in this folder:
.config/lxsession/LXDE-pi/
Create a new file and write these lines of code:
sudo nano .config/lxsession/LXDE-pi/autostart
@xset s off
@xset -dpms
@xset s noblank
@unclutter -idle 0
@chrimium-browser --kiosk --app=http://my_domain.com/gauge_01.php
Additional Information
I chose Google Gauge charts for this display, but any charts would work. To display two values I thought that a bar or column style would look awkward. A line graph that updates the last ten readings would perhaps look better.
Next thing I plan to do with this build is make a nice wooden box around it.
Conclusion
In this article, we’ve used data from a previous database, and made a Raspberry Pi connect to a webserver and display a page. On the server side, we have a webpage that updates every 10 seconds, extracting data from the database and displaying the values in two gauge charts.
Source code