In this article, I’ll show you how to extract data from a mySQL database and display it in a few different graphs!
There are a few different sources for making graphs on the Internet. I’m going to focus on Google Chart, mainly because Google is a big company so their website is unlikely to go down.
Google offers a large range of different charts: column, bar, combo, area, stepper, and line charts, to name a few. We’re going to focus on the line, bar, and column charts. Obviously, we’re showing the graphs in a web browser.
Hardware Used in This Tutorial
I have a Raspberry Pi 3 Model B connected to the internet, running Apache, which is the webserver we’re using. This Raspberry Pi also has MariaDB installed, which is the mySQL database we’re getting data from.
Software Used in This Tutorial
- Noobs, installed on the Raspberry Pi
- LAMPS, installed on the Raspberry Pi
- Sublime, installed on my development computer
Extracting the Data
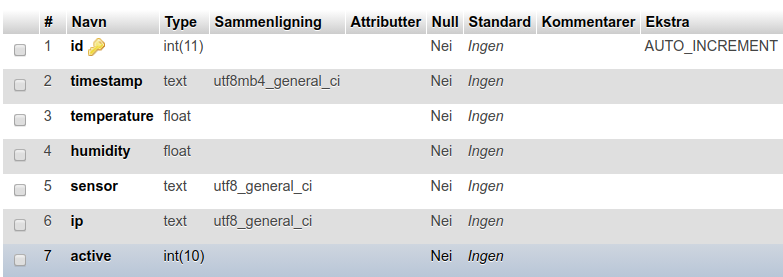
To make a graph, we need some data. The data we’re using is from a temperature and humidity table in a database called db_Kajsa. This is on my server and it includes measurements it’s collected throughout the exceptionally warm winter we’ve had in Norway this year. The table is listed below.
Table of readings from db_Kajsa.
For now, we’re only interested in the timestamp and the temperature.
To be able to connect to the database, we need:
- The webserver’s address
- A username and password
- The name of the database to connect to
- The name of the table we’re getting data from
All this information, we put in a file called db_config.ini:
[database]
db_host = "localhost"
db_name = "db_Kajsa"
db_table = "tbl_temperature"
db_user = "my_user_name"
db_password = "my_password"
Since we saved this as a *.ini file, we need to use PHP’s parse_ini_file function. One of the reasons I choose to store all the login credentials in one file is maintenance. It’s far more efficient to have all the info in one file, instead of all the files that needs to extract data from the database. This file is stored in a folder called “cfg” which is a subfolder in the root directory of my web server.
The following code is the way I read the *.ini-file onto my web page:
# Loading config data from *.ini-file
$ini = parse_ini_file ('cfg/db_config.ini');

# Assigning the ini-values to usable variables
$db_host = $ini['db_host'];
$db_name = $ini['db_name'];
$db_table = $ini['db_table'];
$db_user = $ini['db_user'];
$db_password = $ini['db_password'];
Now that we have our login credentials loaded into our main file, it’s time to connect to the database. We’ll be extracting the last 10 readings.
# Prepare a connection to the mySQL database
$connection = new mysqli($db_host, $db_user, $db_password, $db_name);

# If there are any errors or the connection is not OK
if ($connection->connect_error) {
	die ('Connection error: '.$connection->connect_error);
}
else {
	echo 'Connection is OK.<br />'; # For debugging purposes
}

# Prepare a query to the mySQL database and get a list of the last 10 readings.
$sql = "SELECT * FROM $db_table WHERE sensor='Kajsa' ORDER BY id DESC LIMIT 10";
$result = $connection->query($sql);

# If we have at least one hit, we'll show it
if ($result->num_rows > 0) {
	while ($row = $result->fetch_assoc()) {
		echo "Celsius: ".$row['temperature']."<br />";
	}
} else {
	echo "<p>0 result. The ".$db_table." must be empty.</p>";
}
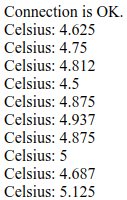
If we put those two blocks of code in a *.php file and open it in a web browser, this is what we’ll get:
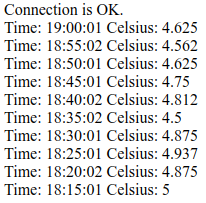
This tells us that the connection to the database is working, and then shows the 10 last posts in the database. Now this is a good start, but if we tweak the code a little, we’ll also be able to get the timestamp:
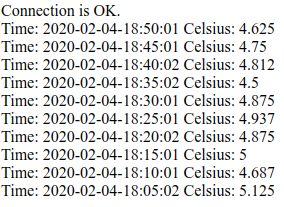
To get the timestamp listed all we needed to do was add it in the while-loop, like this:
echo "Time: ".$row['timestamp']." Celsius: ".$row['temperature']."<br />";
As it is now, we get the complete timestamp. What if we only wanted the time and not the date? No problem. We just remove everything but the last 8 characters:
$timestamp_rest = substr($row["timestamp"],-8);
echo "Time: ".$timestamp_rest." Celsius: ".$row['temperature']."<br />";
So now we have a table with some data. Let’s visualize it. As mentioned, Google offers a wide range of charts. We’ll take a closer look at three of them.
Different Ways to Chart the Data
The source codes are fairly well commented and are in a downloadable zip file.
Common for all of the charts is they load the same JavaScript loader, which is coded in the header section of your file.
<script type="text/javascript" src="https://www.gstatic.com/charts/loader.js"></script>
Then we need to select the chart package we want to use. In our case we’re using two packages: corechart and bar. We’ll be focusing on the corechart-package. This package has, amongst others, the LineChart-chart. After the corechart package is loaded, we tell the browser to draw a chart when the page loads. We call the function drawChart.
In the beginning of the drawChart-function we define our data. It is a bit more hassle, since we’re getting it from a mySQL database, but when I right-click and select “show source” in a browser, this is the beginning of the function:
function drawChart() {
	var data = google.visualization.arrayToDataTable([
	['Time', 'Temperature'],
	['19:00:01',4.625],['18:55:02',4.562],['18:50:01',4.625],
	['18:45:01',4.75],['18:40:02',4.812],['18:35:02',4.5],
	['18:30:01',4.875],['18:25:01',4.937],['18:20:02',4.875],
	['18:15:01',5],
	]);
In our source file, this is the beginning of the function:
function drawChart() {
	var data = google.visualization.arrayToDataTable([
	['Time', 'Temperature'],
<?php

# This query connects to the database and get the last 10 readings
$sql = "SELECT temperature, timestamp FROM $db_table WHERE sensor='Kajsa'
		ORDER BY id DESC LIMIT 10";

$result = $connection->query($sql);

# This while - loop formats and put all the retrieved data into ['timestamp', 'temperature'] way.
	while ($row = $result->fetch_assoc()) {
		$timestamp_rest = substr($row["timestamp"],-8);
		echo "['".$timestamp_rest."',".$row['temperature']."],";
		}
?>
]);
If we’re only using static data, it’s ok to hardcode them into the webpage. However, we’re using dynamic data, so we have to connect to the database inside the drawChart function, extract the data, and format it to the way Google Chart wants it.
Then we need to tell drawChart a few things about the chart we want, like title, curveType, and where to put the legend:
// Curved line
var options = {
		title: 'Temperature',
		curveType: 'function',
		legend: { position: 'bottom' }
		};
After that, we need to make and draw the chart:
// Curved chart
var chart = new google.visualization.LineChart(document.getElementById('curve_chart'));
chart.draw(data, options);
Lastly, we need a way to display the chart. This is done by putting it in a div-tag:
<div id="curve_chart" style="width: 900px; height: 480px;"></div>
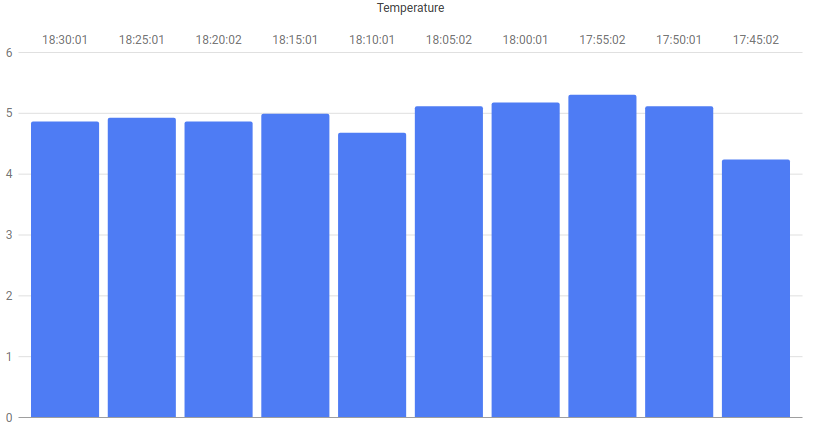
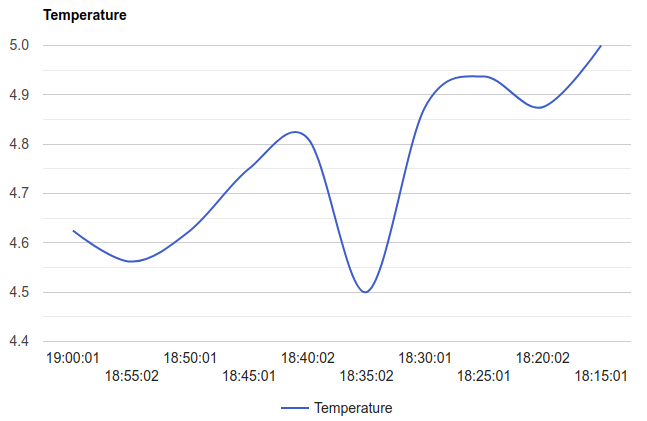
This code should result in something like this:
The data graphed as a line chart.
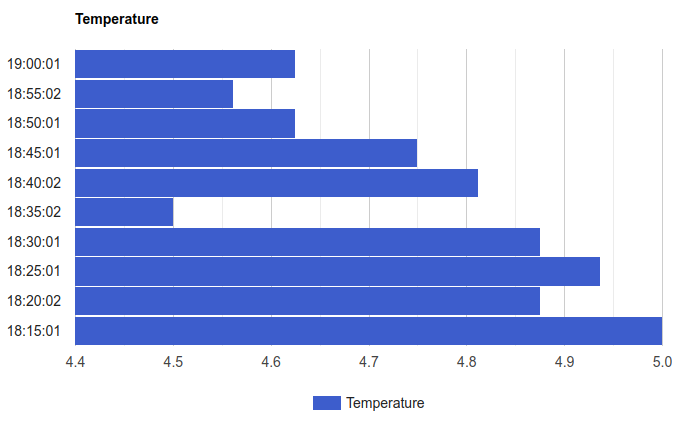
In the source code, you’ll also find code to make a column chart and a bar chart.
The same information as a bar chart.
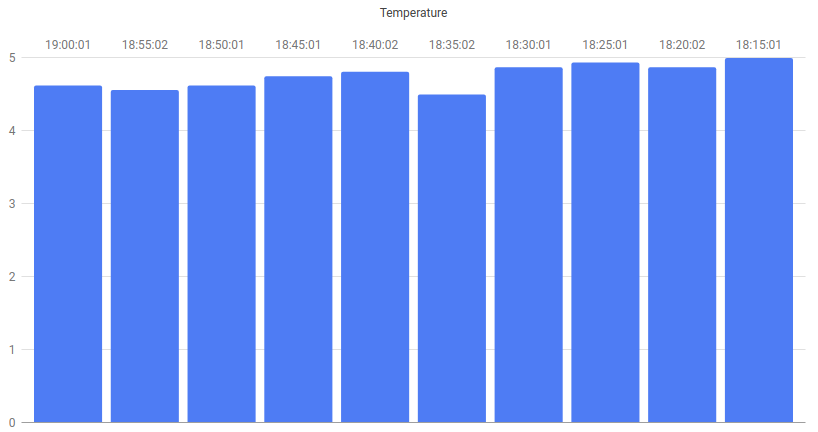
The same information as a column chart.
Further Steps
If you’d like to add more to your graph, the next step would be to add the humidity to the chart combined with the temperature.
In this article I showed you one way to connect to a mySQL database, extract some data, and making a few different charts, based on Google Chart.