Learn how to graph temperature values with the DHT22 temperature sensor using matplotlib on Raspberry Pi.
In this article, you are going to learn how to graph the temperature values with respect to time using the matplotlib library. We will use the DHT22 temperature sensor to read temperature values and will store the temperature and time in a csv file.
The csv file will contain the data of all the previous hours and a new value will be added each hour. Then, we will plot a live graph, which will update right after each new value is added in the csv file. The plotted graph will show data for the last 24 hours.
Installing the Library for DHT22
To install the library, follow these steps:
- Download the library with this command: git clone https://github.com/adafruit/Adafruit_Python_DHT.git
- In the installed directory, type the following command: cd Adafruit_Python_DHT
- Download the required modules using the following command: sudo apt-get install build-essential python-dev
- Install the library using this command: sudo python3 setup.py install
Required Components
The components you are going to require for this tutorial are:
- Raspberry Pi with Python 3
- DHT22 temperature and humidity sensor
- 10k resistor
- Jumper cables
Circuit Diagram and Explanation
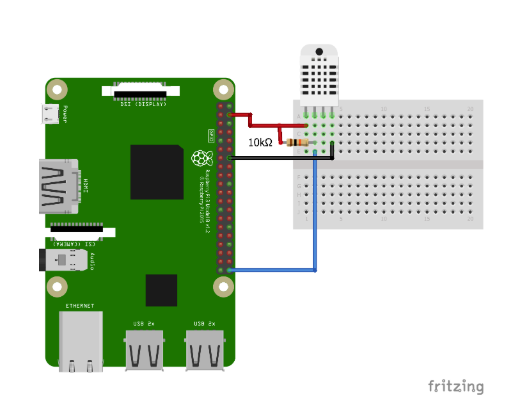
Make the connections of the DHT22 with the Raspberry Pi described in the table below.
DHT22 | Raspberry Pi |
|---|
VCC | 5V |
Data Pin | Connect to GPIO 23 and also connect to 5V through 10k resistor |
GND | GND |
Circuit Diagram of RPi and DHT22.
Connections between the DHT22 and the Raspberry Pi.
Code Explanation
First, import the required library and modules for this project:
- Adafruit_DHT library will help us in reading the temperature values from the Raspberry pi.
- Pyplot module from the matplotlib library will help us in plotting the graphs. Animation module from the matplotlib library will help us in drawing the live graphs.
- Datetime library will help us in getting the current time so that we can store the temperature with respect to time in the csv file.
import Adafruit_DHT as dht    # Importing Adafruit library for DHT22
import matplotlib.pyplot as plt
import matplotlib.animation as animation
import numpy as np
from datetime import *
plt.figure() is used to create a figure object.
Using the fig.add_subplot(1, 1, 1) command, create an axes object in the figure. Using this method gives users the advantage of easily handling multiple figures/axes without getting confused as to which one is currently active.
fig = plt.figure()
ax = fig.add_subplot(1, 1, 1)
Read the temp value from the DHT22 sensor and format these values up to 1 decimal point. Then, open the csv file in writable mode and save the time and temperature.
_ , temp = dht.read_retry(dht.DHT22, dht22Pin)
	temp = ('{0:0.1f}'.format(temp))
	with open("cpu_temp.csv", 'a') as log:
		log.write("{0},{1}\n".format(datetime.now().strftime("%H:%M:%S"),str(tem
Open the file in readable mode and read all the lines from the csv file. Then, read only last 24 lines and store the temperature and time separately.
with open('cpu_temp.csv','rb') as f:
		lines = f.readlines()
	mydata = np.genfromtxt(lines[-24:], delimiter=',', names=col_names, dtype=[('T', 'O'), ('V', 'u1')], converters={"Time": dateconv})
Clear the graph and map these values in the graph. Temperature is plotted on the y-axis and time is plotted on the x-axis.
plt.xticks(rotation=45, ha='right')
plt.subplots_adjust(bottom=0.30)
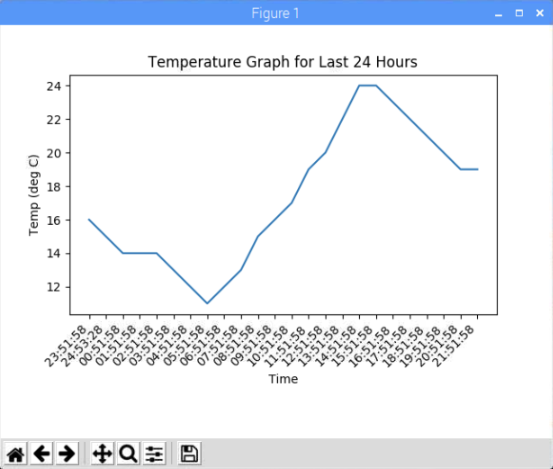
plt.title('Temperature Graph for Last 24 Hours')
plt.ylabel('Temp (deg C)')
plt.xlabel('Time')
The last line acts to plot the live graphs. It calls the animate function after an hour.
ani = animation.FuncAnimation(fig, animate, interval=1000*60*60)
The temperature graph after 24 hours.
Code
This code only works with Python 3 and is as follows:
# Only works with python 3
import Adafruit_DHT as dht
import matplotlib.pyplot as plt
import matplotlib.animation as animation
import numpy as np
from datetime import *

dht22Pin = 21
dateconv = lambda s: datetime.strptime(s, "%H:%M:%S")
col_names = ["T", "V"]

fig = plt.figure()
ax = fig.add_subplot(1, 1, 1)

def animate(i):
	_ , temp = dht.read_retry(dht.DHT22, dht22Pin)
	temp = ('{0:0.1f}'.format(temp))
	with open("cpu_temp.csv", 'a') as log:
		log.write("{0},{1}\n".format(datetime.now().strftime("%H:%M:%S"),str(temp)))

	with open('cpu_temp.csv','rb') as f:
		lines = f.readlines()

	mydata = np.genfromtxt(lines[-24:], delimiter=',', names=col_names, dtype=[('T', 'O'), ('V', 'u1')], converters={"Time": dateconv})
	ax.clear()
	ax.plot(mydata['T'], mydata['V'])

	plt.xticks(rotation=45, ha='right')
	plt.subplots_adjust(bottom=0.30)
	plt.title('Temperature Graph for Last 24 Hours')
	plt.ylabel('Temp (deg C)')
	plt.xlabel('Time')
ani = animation.FuncAnimation(fig, animate, interval=1000*60*60)
plt.show()