Display the current ambient temperature and the historical average for the certain day on an LCD using Raspberry Pi
Display the current ambient temperature and the historical average for the certain day on an LCD using Raspberry Pi, aWhere API, and SunFounder libraries.
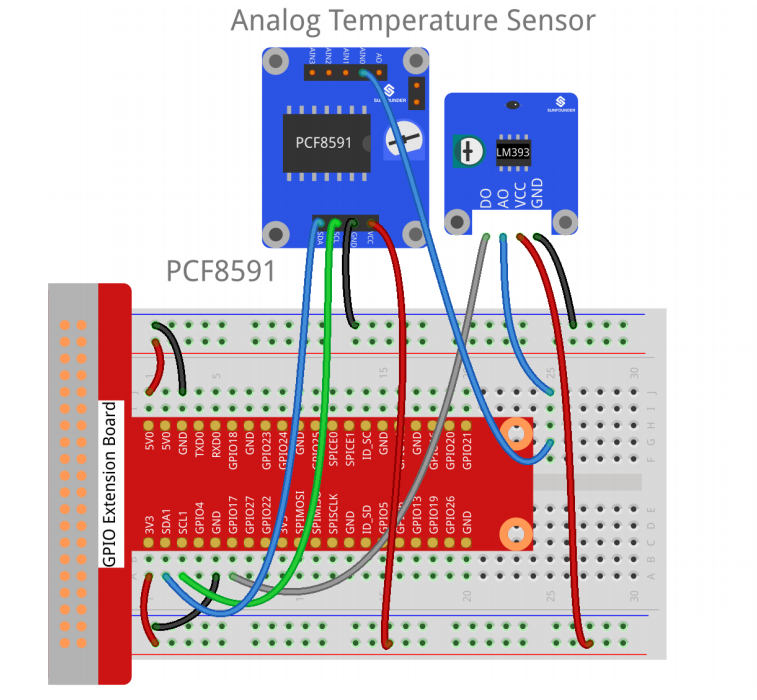
Raspberry Pi Temperature Sensor
I used the Sensor Kit V2.0 from SunFounder, which comes with an analog temperature sensor, and their PCF8591, which is a data acquisition device. I used their sample wiring which is seen below and can be found here.
Once wired correctly, use their sample code to test the configuration. You can download that here. Their code comes in both python and c, we will be using python.
If you are doing this remotely, then you can download the code on your computer and use FileZilla to move it to your Raspberry Pi.
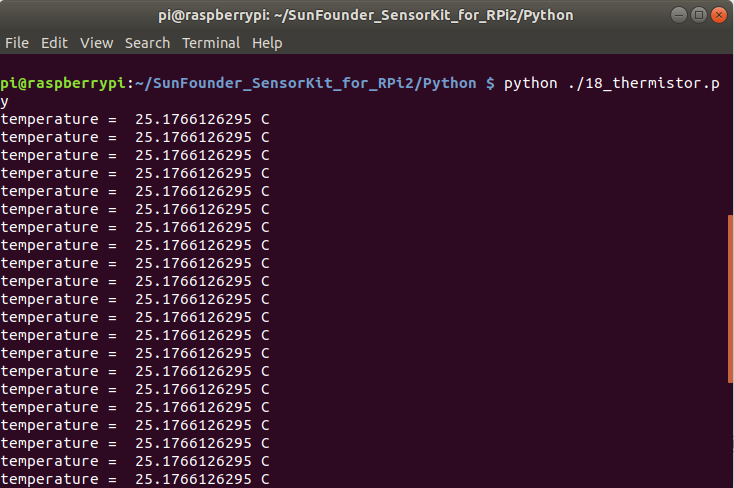
To test your wiring you'll want to run the file '18_thermistor.py'. The output should look something like this.
Using the Raspberry Pi LCD
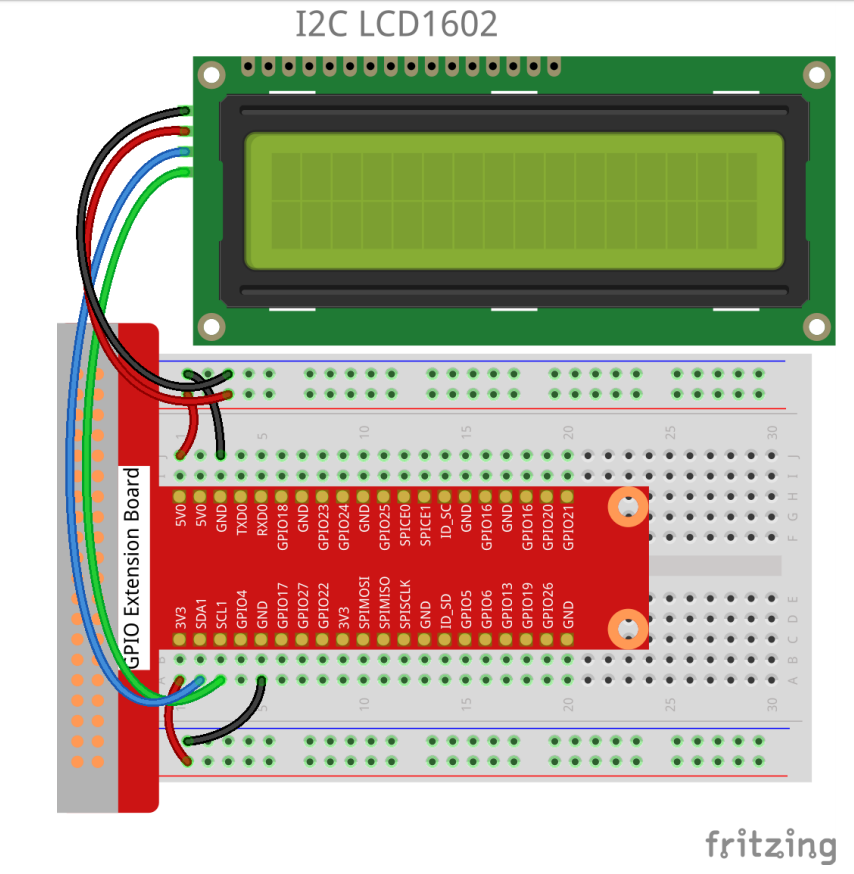
The LCD I used was interfaced to only have four wires. Leave the temperature sensor wired. Following the wiring provided by SunFounder, setting up the LCD is pretty simple. The LCD and the temperature sensor wiring overlap on the 'SDA1' and 'SCL1' pins, and this is okay. It works sharing those pins. If you are curious as to why, the simplest answer I found is here in the first reply.
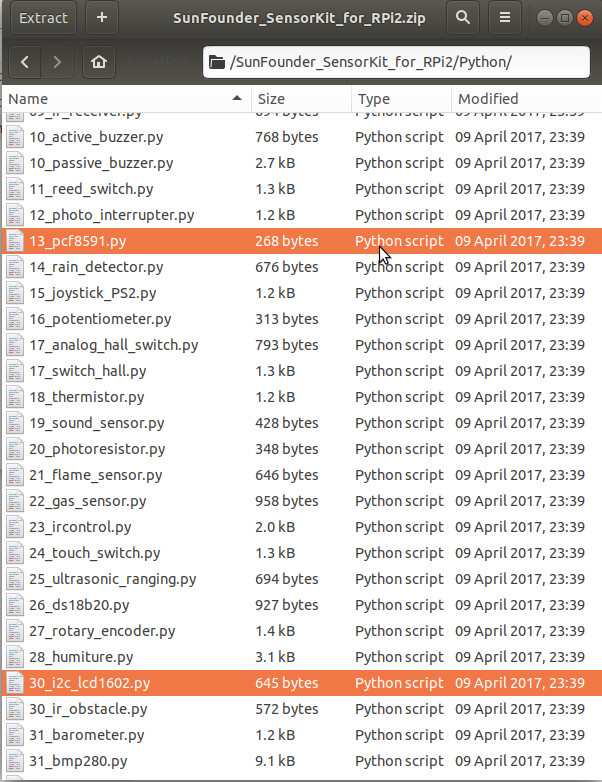
To display the current temperature on the LCD, create a new directory, mine was 'LCDTemp', and copy the two files highlighted below from the SunFounder python code directory, into your new directory. These are libraries specific to the SunFounder Kit hardware (I haven't tested if they work with other sensors).
Now that you have those libraries its time to start writing code to display the current temperature on the LCD. Mine looked like this:
#*****dispTemp.py*****#
from decimal import Decimal
import RPi.GPIO as GPIO
import PCF8591 as ADC
import math
import time
import LCD1602 as LCD

tempPin = 11  # temperature D0 pin
GPIO.setmode(GPIO.BOARD)  # reference pins using BOARD numbers


# *****Initialize Pins*****#
def setup():
    ADC.setup(0x48)  # set up analog converter
    GPIO.setup(tempPin, GPIO.IN)  # set pin to input
    LCD.init(0x27, 1)  # init(slave address, background light)


def loop():
    while True:
        analogVal = ADC.read(0)  # read temperature sensor value
        # Calculations to convert to Celsius, from SunFounder
        Vr = 5 * float(analogVal) / 255
        Rt = 10000 * Vr / (5 - Vr)
        temp = 1 / (((math.log(Rt / 10000)) / 3950) + (1 / (273.15 + 25)))
        temp = Decimal(temp - 273.15)  # convert to Decimal Type
        temp = round(temp, 1)  # round to 1 decimal point
        LCD.write(0, 0, 'Temp: {} C'.format(temp))  # write to top row and farthest left column of LCD
        time.sleep(1)  # update every second

# *****MAIN*****#
if __name__ == '__main__':
    try:
        setup()
        loop()
    except KeyboardInterrupt:
        pass
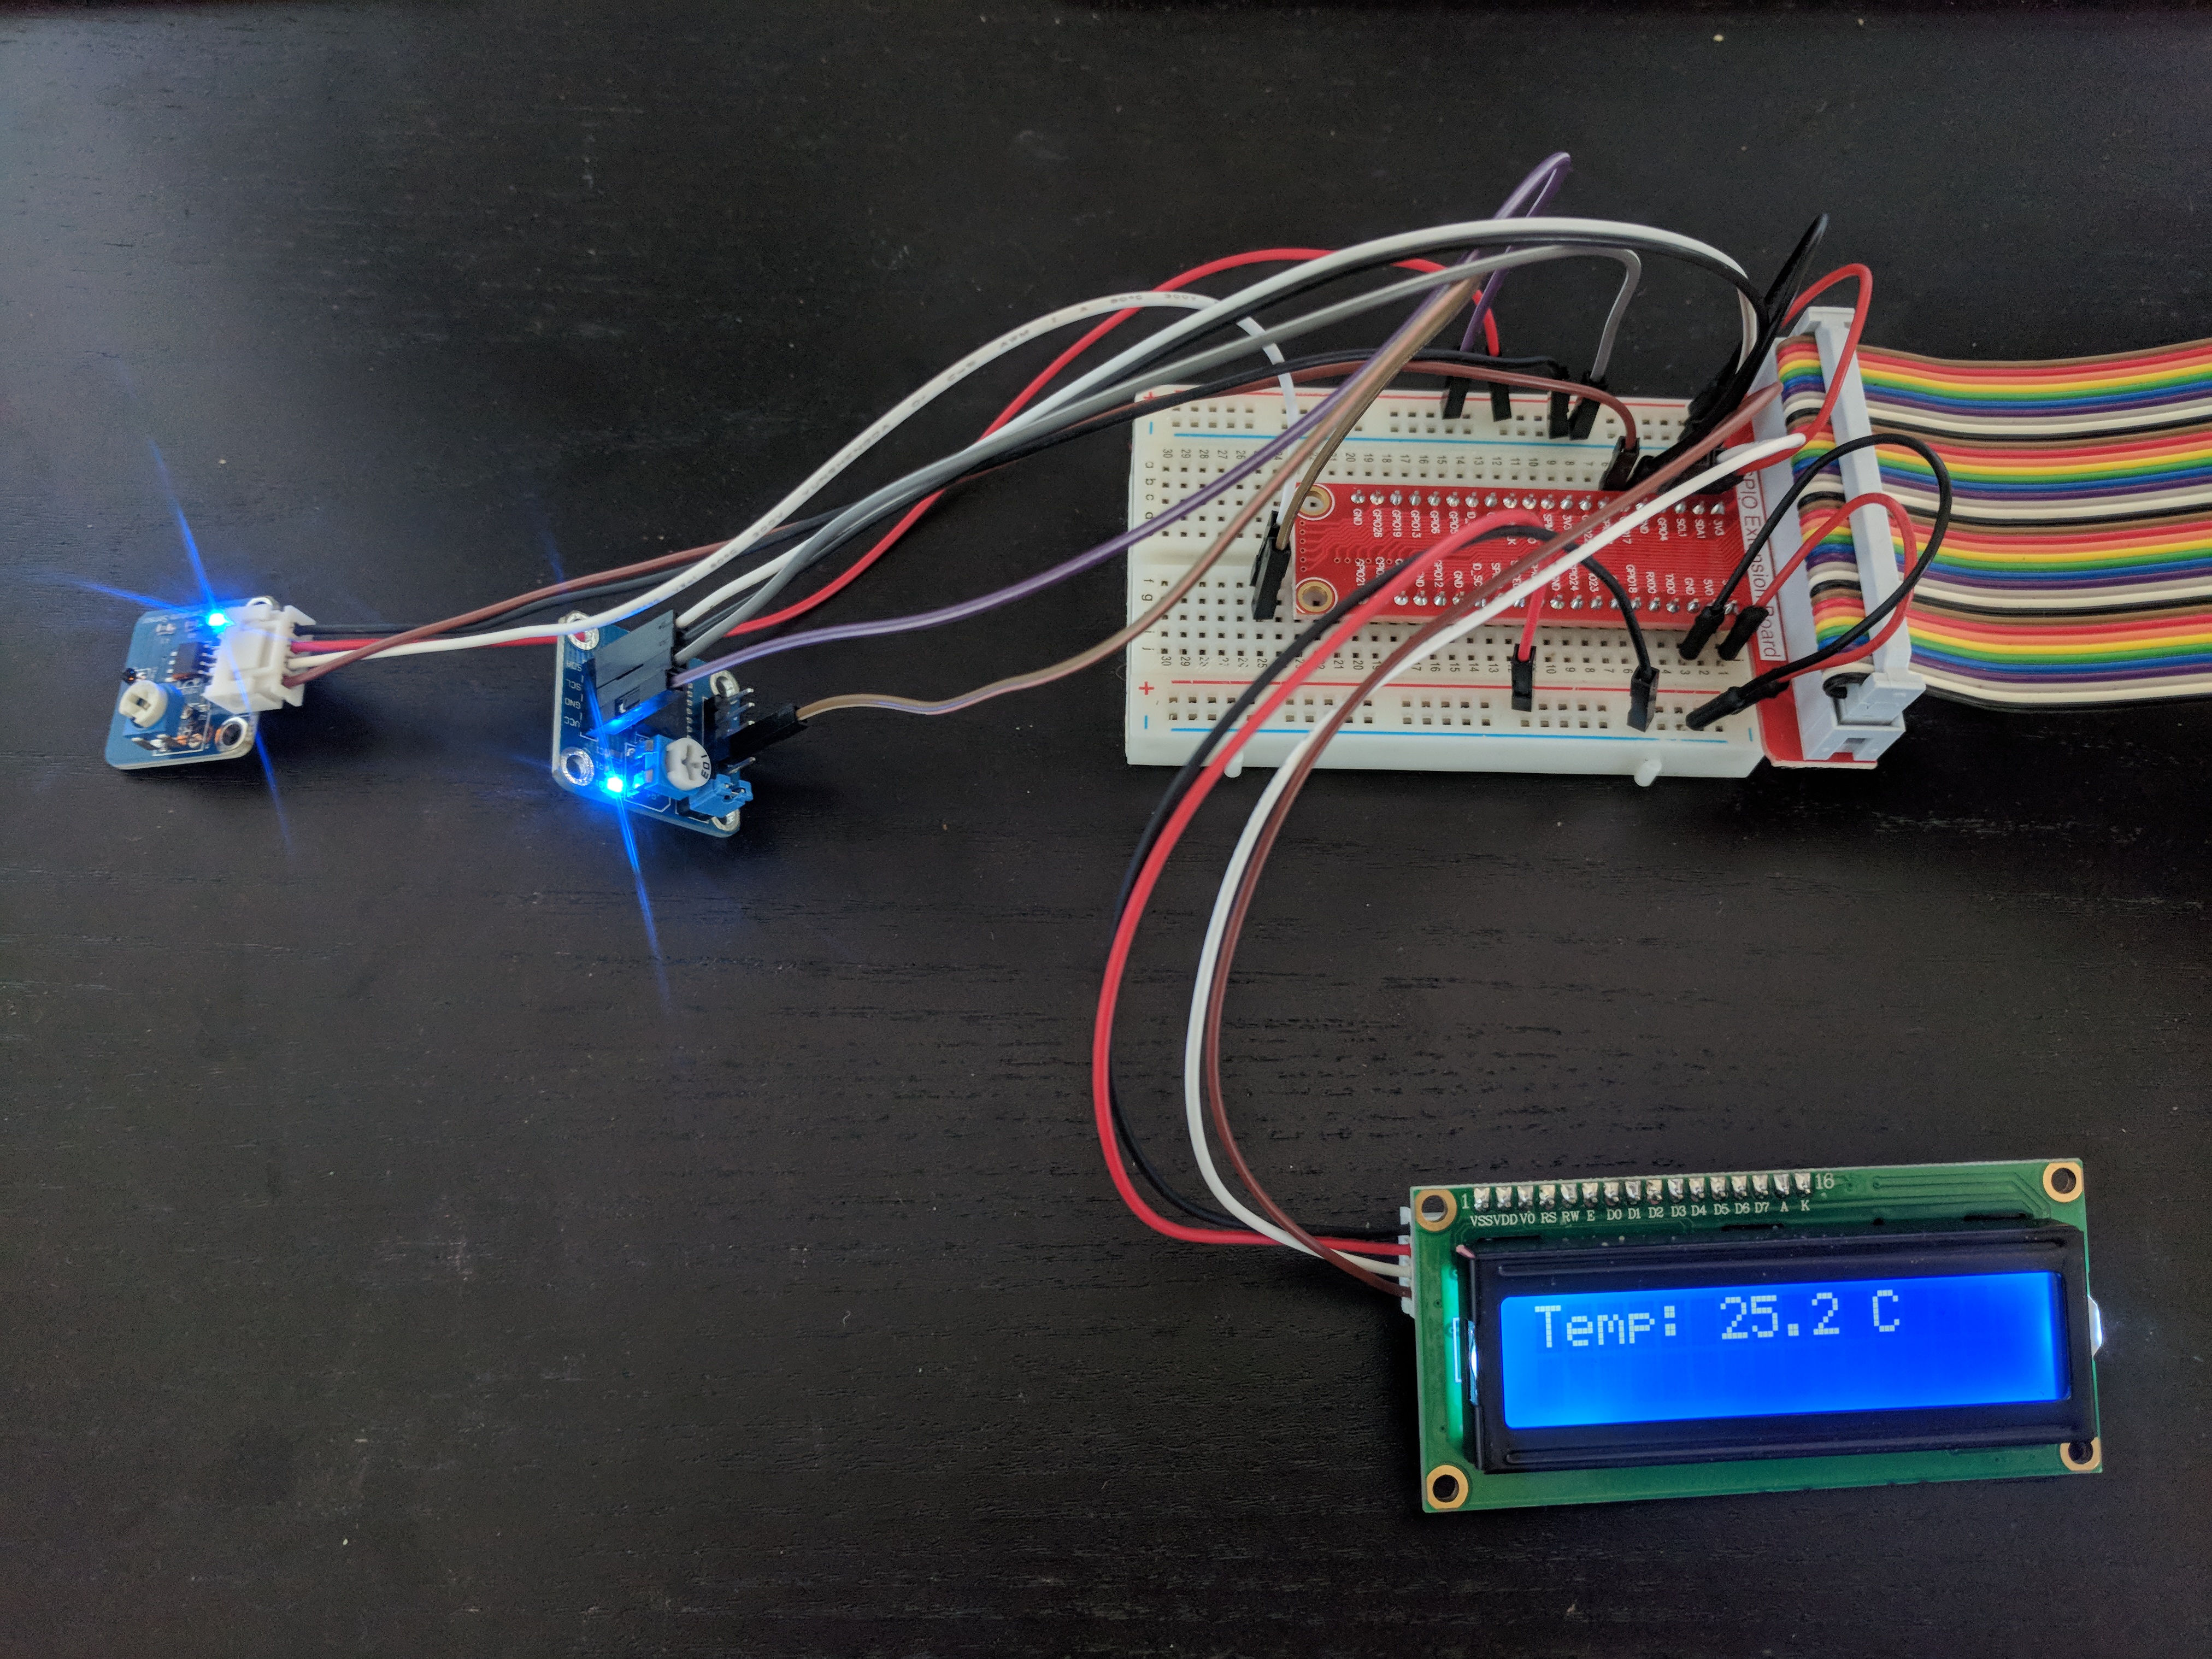
If wired correctly, the code above should turn out something like the photo below, depending on your temperature.
Getting Historical Weather Data using aWhere API
The easiest free API I could find for getting average historical temperatures for a specific location was using aWhere. With aWhere you can get all kinds of historical weather data but I stuck with temperature as its all that would fit on the LCD. (Without Scrolling)
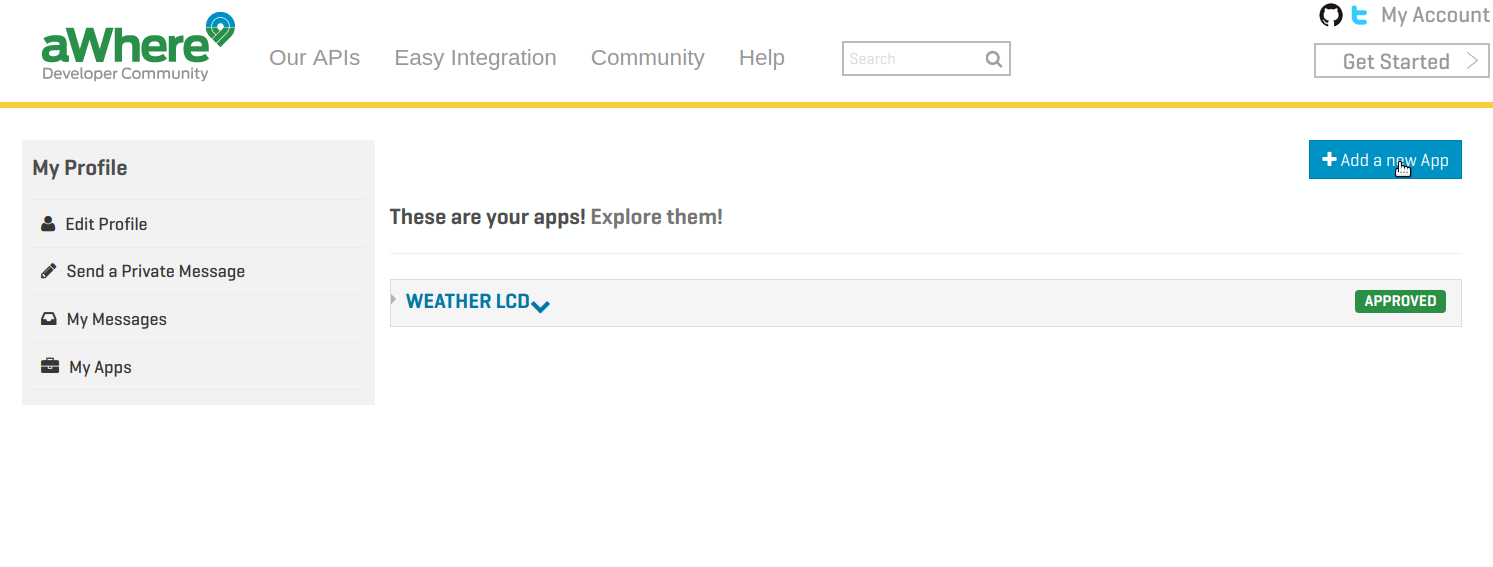
You can sign up for a free aWhere account here. Once signed up, go to 'My Account' in the top right hand corner and click on the 'My apps' drawer. Inside 'My Apps' click the blue 'Add a new App' button as seen below, and name it.
By creating an app you will receive a 'Consumer Key' and 'Consumer Secret', we'll use those to get an authentication token in the code below.
Create a Field
aWhere seems to be some kind of agriculturally aimed service, so naturally, to specify a location to get the temperature from we'll need to 'add a field' to our app.
The documentation for adding a field can be found here. I originally tried two different ways using 'requests' and 'urllib' but couldn't get it working. The only python example I found that worked was in the answer section here, and that's what I based the code below off of.
#*****addField.py*****#
import json
from oauthlib.oauth2 import BackendApplicationClient
from requests_oauthlib import OAuth2Session

url = 'https://api.awhere.com/v2/fields'
consumer_key = '' # key
consumer_secret = '' # secret

# body of request, change to wherever you would like
body = {
    "id": "CN_Tower",
    "name": "Toronto",
    "farmId": "accr",
    "centerPoint": {
        "latitude": 43.642465, # can get these from Google maps
        "longitude": -79.386488
    }
}

# get Authentication token
client = BackendApplicationClient(client_id = consumer_key)
oauth = OAuth2Session(client=client)
token = oauth.fetch_token(token_url='https://api.awhere.com/oauth/token', client_id=consumer_key, client_secret=consumer_secret)

# post body to url
client = OAuth2Session(consumer_key, token=token)
field_response = client.post(url, json=body)
print(field_response.json())
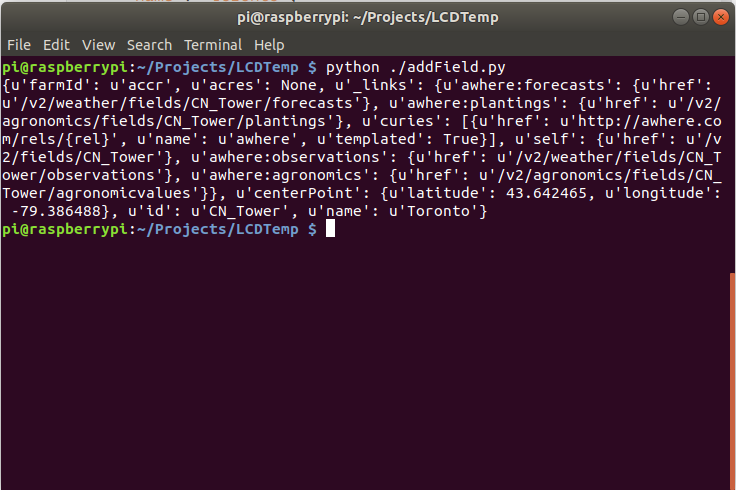
After running the code above, if you successfully added a field the output should look something like this. (depending on the location your chose)
Get Historical Weather Data
Now that you have successfully created a field, you can now pull historical weather data for that geographical location. aWhere's documentation for this can be found here.
This step is pretty simple, the code below should just return the average temperature for that day over the last 10 years.
#*****histWeather.py*****#
import requests, json, base64

id = 'CN_Tower' # field id
date = '05-23' # month and day that you would like 10 year average for
key = ''
secret = ''

# *****Get aWhere security token*****#
def getToken():
    combination = key+':'+secret.encode()
    auth = base64.b64encode(combination).decode('utf8')

    credential = auth
    response = requests.post('https://api.awhere.com/oauth/token',
                             data='grant_type=client_credentials',
                             headers={'Content-Type': 'application/x-www-form-urlencoded',
                                      'Authorization': 'Basic {}'.format(credential)}).json()

    if 'access_token' and 'expires_in' in response.keys():
        print(response['access_token'])
        return response['access_token']
    else:
        raise ValueError(response)


token = getToken()  # get auth token

headers = {"Authorization": "Bearer " + token,
           "Content-Type": "application/json"}
response = requests.get('https://api.awhere.com/v2/weather/fields/'+id+'/norms/'+date, headers=headers)
data = response.json()
print(str(data['meanTemp']['average']))
print(response)
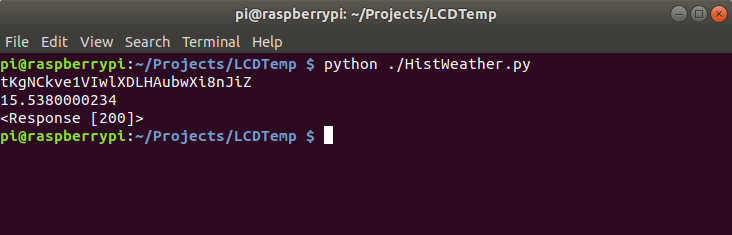
The output of this file should look something like this:
The 15 in the picture above is the average temperature in Celsius.
Putting it all Together
Now that we have the current ambient temperature, as well as the average historical temperature, its time to put it all together and display it on our LCD.
The historic temperature data only goes down to the individual day, so the code is designed to update the ambient temperature every second, but the average temperature only once a day. It compares the day using a counter 'currDay'.
#*****LCDTemp.py*****#
from decimal import Decimal
import RPi.GPIO as GPIO
import PCF8591 as ADC
import math
import time
import LCD1602 as LCD
import requests, json, base64, datetime

tempPin = 11  # temperature D0 pin
GPIO.setmode(GPIO.BOARD)  # reference pins using BOARD numbers
key = ''  # Consumer Key
secret = ''  # Consumer Secret


# *****Initialize Pins*****#
def setup():
    ADC.setup(0x48)  # set up analog converter
    GPIO.setup(tempPin, GPIO.IN)  # set pin to input
    LCD.init(0x27, 1)  # init(slave address, background light)


# *****Main Loop, sets temperatures*****#
def loop():
    currDay = 0  # use currDay as variable to keep track of last numeric day
    while True:
        now = datetime.datetime.now()  # create datetime object called now
        if currDay == now.day:  # if currDay and now.day are equal, only update ambient temperature
            analogVal = ADC.read(0)  # read temperature sensor value
            # Calculations to convert to Celsius, from SunFounder
            Vr = 5 * float(analogVal) / 255
            Rt = 10000 * Vr / (5 - Vr)
            temp = 1 / (((math.log(Rt / 10000)) / 3950) + (1 / (273.15 + 25)))
            temp = Decimal(temp - 273.15)  # convert to Decimal Type
            temp = round(temp, 1)  # round to 1 decimal point
            LCD.write(0, 0, 'Temp: {} C'.format(temp))  # write to top row and farthest left column of LCD
            time.sleep(1)  # update every second

        else:  # if date has changed
            avgTemp = getHistTemp(now.strftime('%m-%d'))  # get average historical temperature for that day
            avgTemp = round(Decimal(avgTemp), 1)  # convert to decimal and round
            LCD.write(0, 1, 'Avg Temp: ' + str(avgTemp) + ' C')  # write to second row of lcd
            currDay = now.day  # update current day


# *****Get aWhere security token*****#
def getToken():
    combination = key + ':' + secret.encode()
    auth = base64.b64encode(combination).decode('utf8')

    credential = auth
    response = requests.post('https://api.awhere.com/oauth/token',
                             data='grant_type=client_credentials',
                             headers={'Content-Type': 'application/x-www-form-urlencoded',
                                      'Authorization': 'Basic {}'.format(credential)}).json()

    if 'access_token' and 'expires_in' in response.keys():  # if response contains access token
        print(response['access_token'])
        return response['access_token']  # return access token
    else:
        raise ValueError(response)


# ***** use aWhere to get historical temperature for certain day*****#
def getHistTemp(date):
    token = getToken()
    headers = {"Authorization": "Bearer " + token,
               "Content-Type": "application/json"}
    response = requests.get('https://api.awhere.com/v2/weather/fields/Toronto/norms/' + date, headers=headers)
    data = response.json()
    return (data['meanTemp']['average'])


# *****MAIN*****#
if __name__ == '__main__':
    try:
        setup()
        loop()
    except KeyboardInterrupt:
        pass
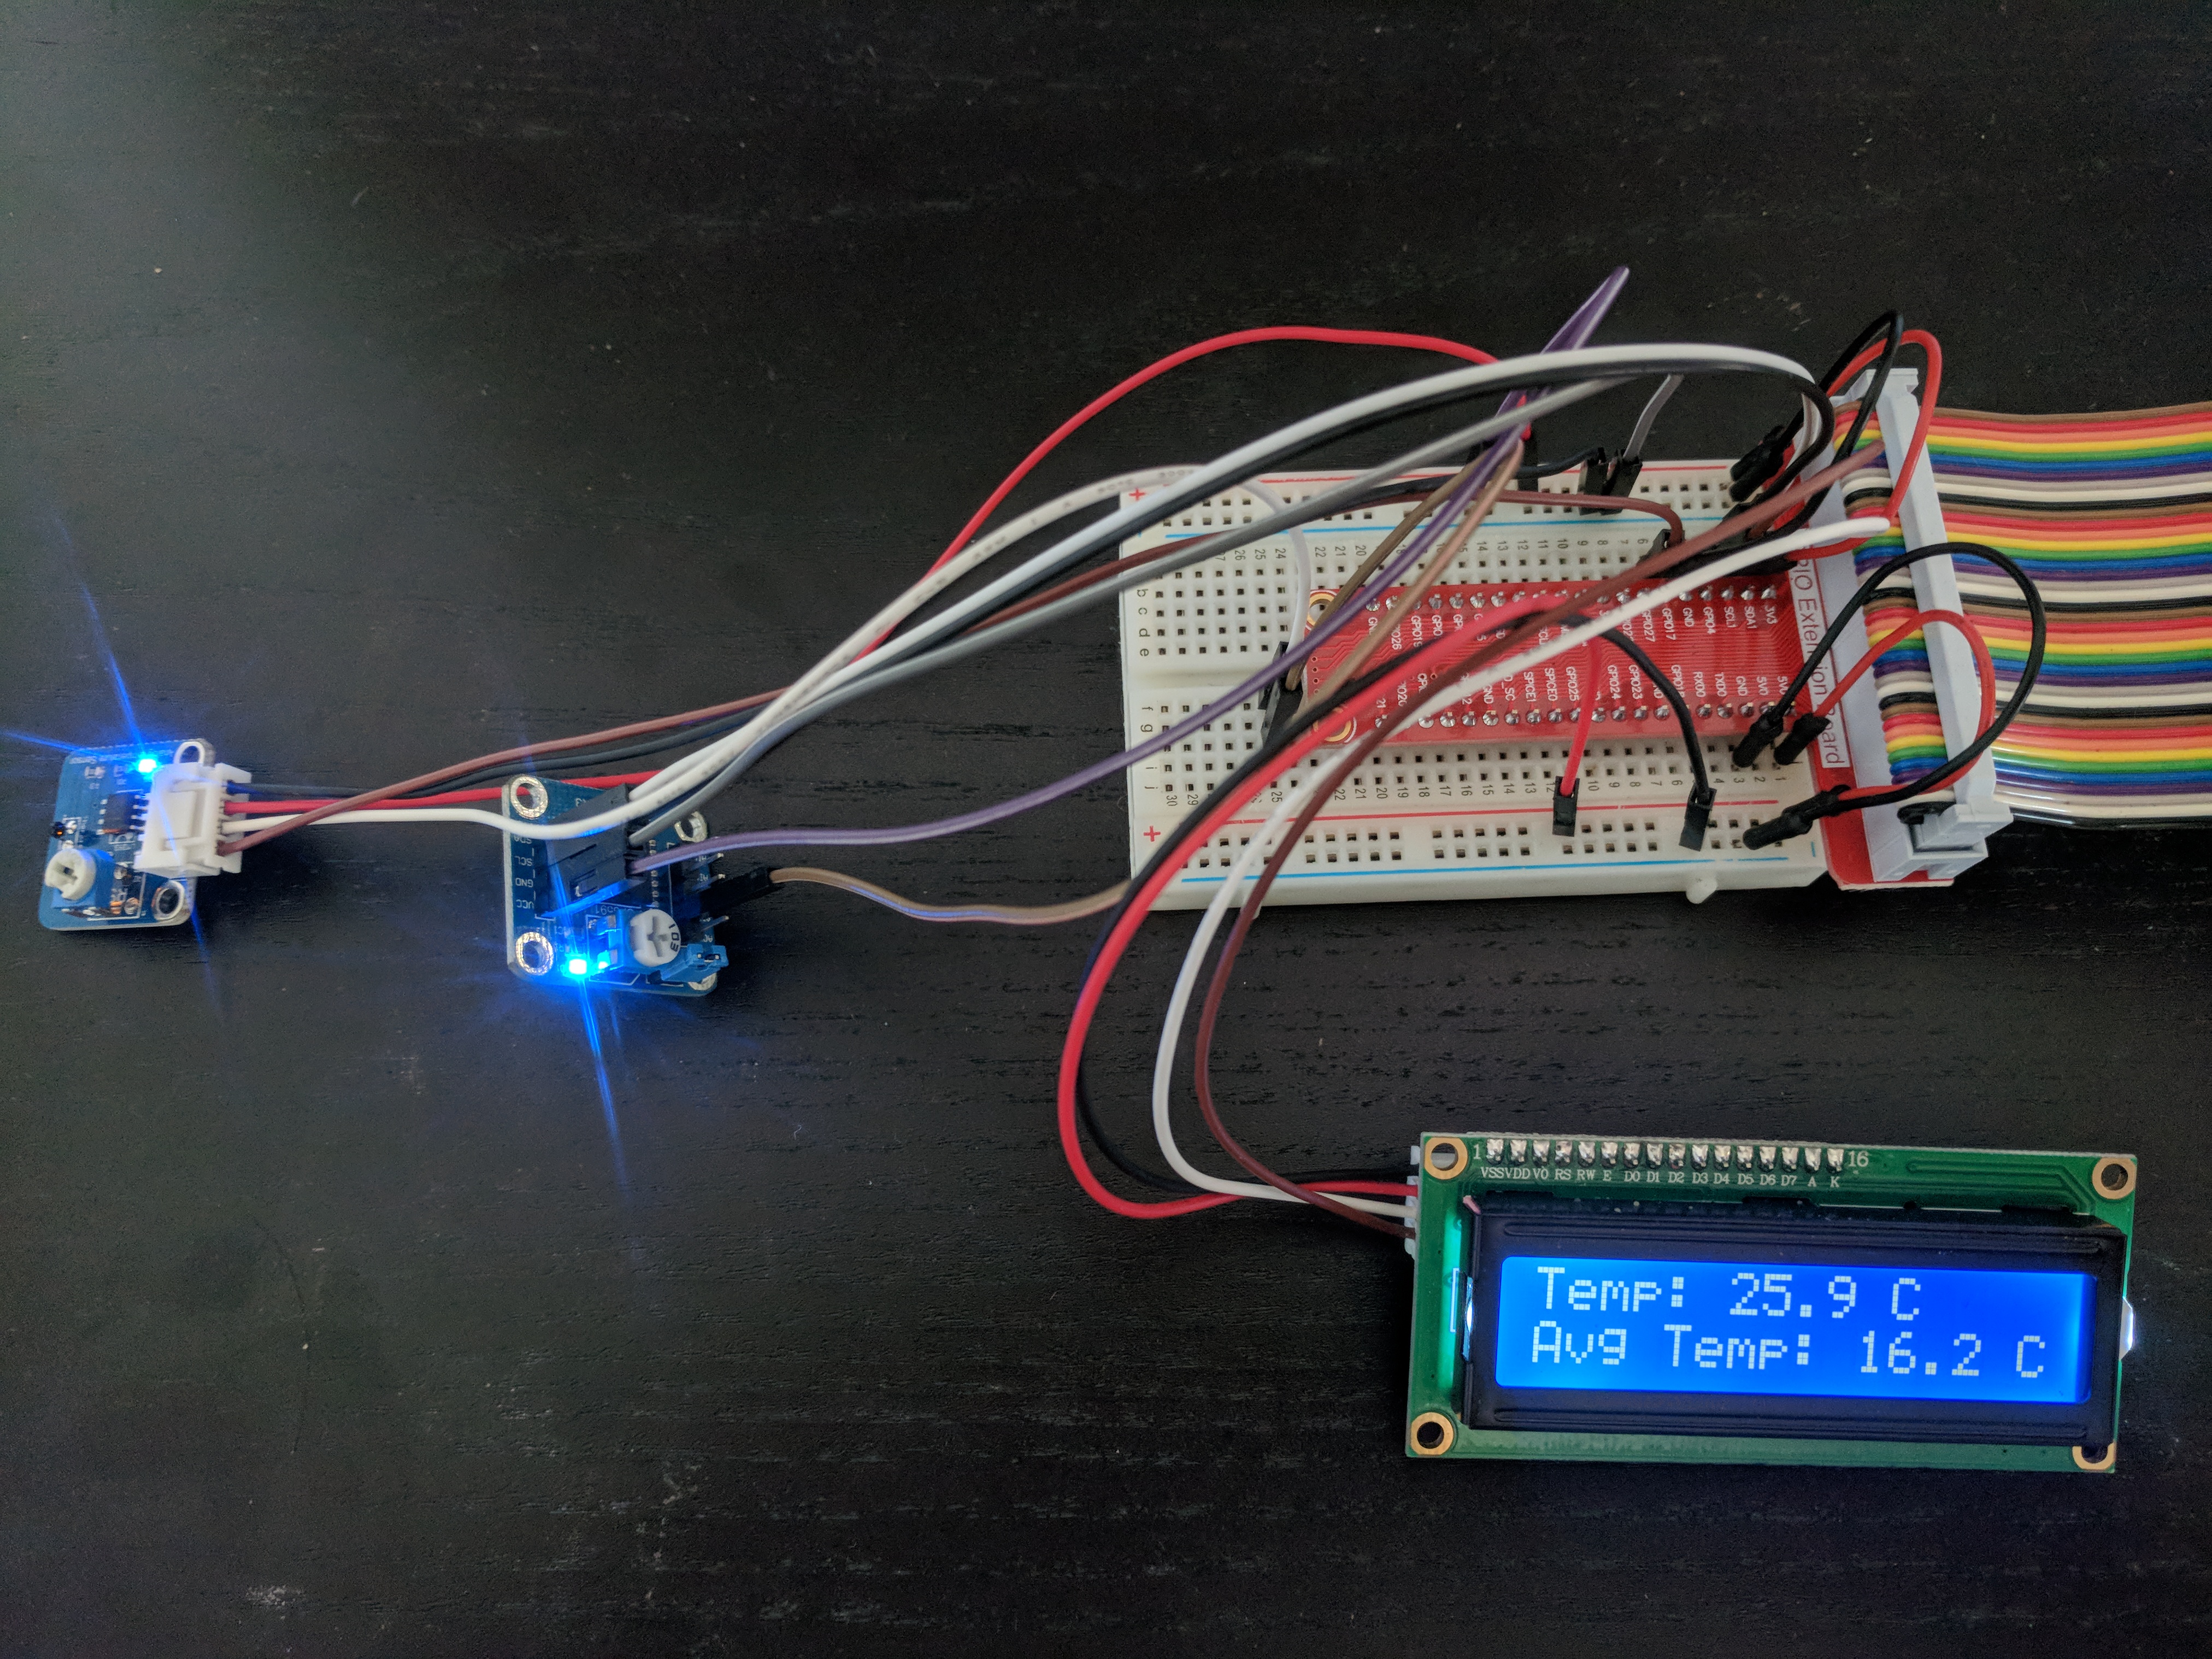
The code has been commented with explanations, but the final product should look something like the image below.
So there you have it, if you have any questions or project recommendations please comment. All the code in the project can be found here. Below is a video of the LCD reacting to my body heat.