This project will show how to get real-time air quality data from Bluetooth device and generate graph on web browser.
Measuring and analyzing real-time air quality data within a particular area is an effective way to keep healthy environment.
For this project, I am using Bluetooth Low Energy USB dongle called BlueIO, which will act as a central device to retrieve data. Hibou Air Quality Monitor which will serve as a peripheral device to transmit the data. The script is simple to use and can be used for other purposes such as store the data into database or cloud.
Things we need:
Before we start
The article assumes you have some general knowledge of how Bluetooth Low Energy (BLE) work. Since the Chrome Serial specification on Google Chrome is not finalized yet, you will have to go to enable the highlighted flag, and restart Chrome.
open chrome://flags/#enable-experimental-web-platform-features in chrome browser.
In this example, we are going to use JavaScript + html (and some CSS for styling) to setup the BleuIO and quickly start scanning.
Step 1:
Clone the git repositories
git clone https://github.com/smart-sensor-devices-ab/Web-Hibou-Sensor-Plotter.git
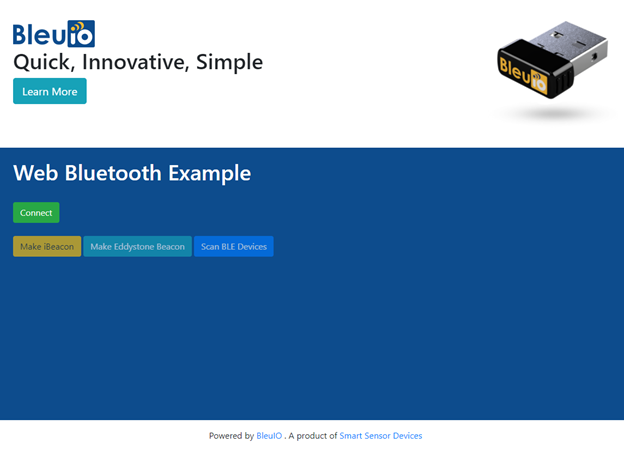
You will have index.html file. This gives you basic layout of the page with connect, scan, and get data buttons.
This script.js has all the codes and uses Chrome Serial to
- Connect to your BleuIO Bluetooth dongle,
- Scan nearby devices using the AT-commands
- Receive and store the data
- Generate real time charts from the data.
All the functions used in the script are well commented for understanding.
The style.css on the root folder gives you some styling to the script.
Connect to the Dongle
Once you have everything ready, open the index.html file.
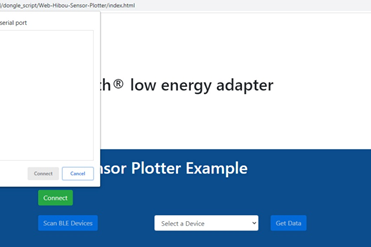
Now connect your BleuIO device to your computer and click connect. Wait for your device to show up on the port screen.
Select your device and press connect.
Once the device is connected, you can scan for nearby devices. For this project I have added a filter so that it will only look for Hibou BLE devices. You will see a list of devices on the dropdown menu. We have a small console on the page that shows scan status and number of devices found. Now you can select a device from the dropdown and start getting data from the device.
Generate Graph
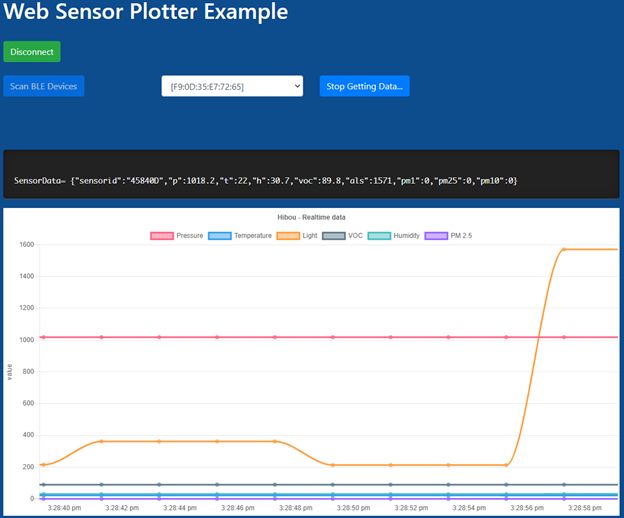
Once you click on get data after selecting a device, it will start to generate graphs using chartjs using real-time data from Hibou Air Quality Monitor.
In my script I am showing Pressure, Temperature, ALS, VOC, Humidity, PM2.5 You can customize your own chart by updating values. All the codes for charts are available on script.js
Follow this video if you find any difficulties.