With an Arduino microcontroller and an AD8232 make yourself an ECG and measure heart rate!
An effective way to analyze and monitor your heart rate is through an electrocardiogram (ECG) heart monitoring system.
In this article, we will be setting up and running the AD8232 heart rate monitor by showing you how to connect it to an Arduino UNO to create heartbeat visualizations using Processing.
NOTE: This project is meant for hobby and learning purposes only; it cannot be used in place of a medical-grade ECG monitor or as a replacement for a professional medical diagnosis.
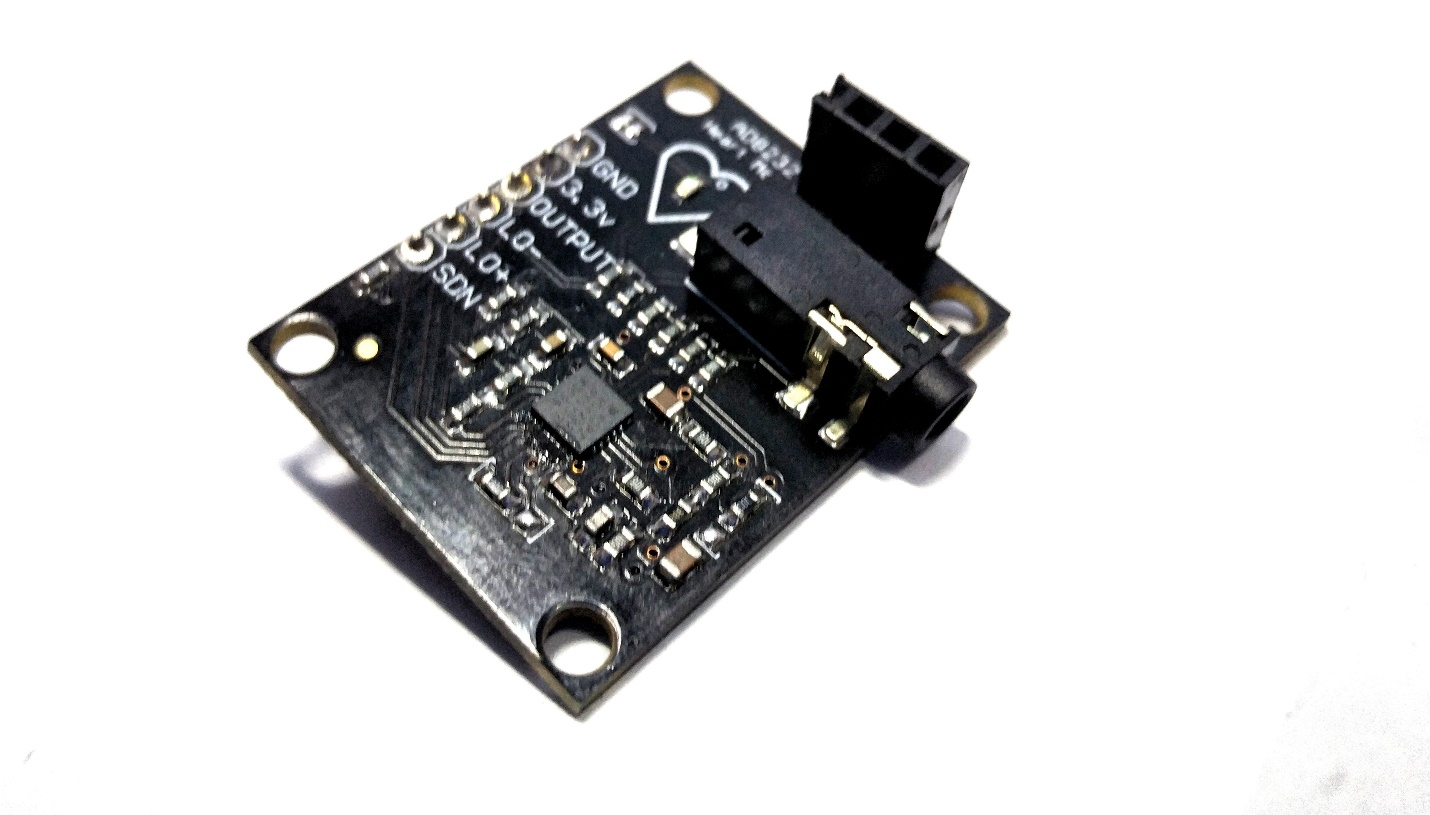
What is the AD8232?
The AD8232 measures the electrical activity of the heart. This electrical activity can be expressed as an ECG. ECG has been popularly used to help diagnose various heart diseases.
The idea is to get the ECG signal from the AD8232 board. The output signal of the AD8232 is approximately 1.5 volts. This signal will be sampled by the Arduino UNO at approximately 1k samples/second. Then these sampled values are sent to the PC for visualization via the USB port.
I recommend using two AA batteries as the power source because there will be too much noise at 60Hz if you power the AD8232 from the 3.3V output on the Arduino UNO. The AD8232 can be powered by a 3V mercury button battery too if needed. Two wires (signal and ground) go from the AD8232 board to the Arduino (A0 and ground). I also used some hot melt adhesive to reinforce the wires at the junction of the AD8232 board.
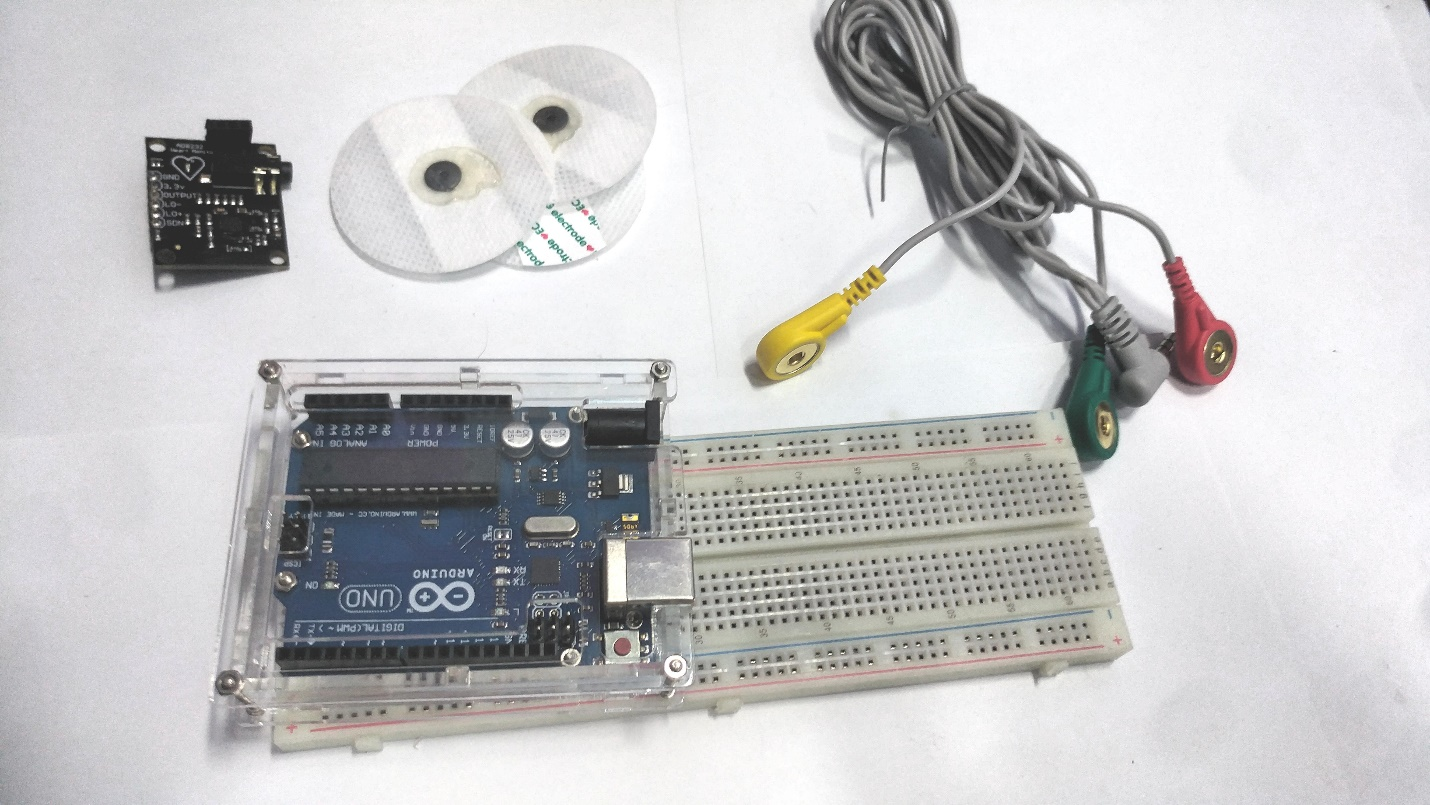
Required Hardware
- Arduino UNO
- AD8232 ECG module
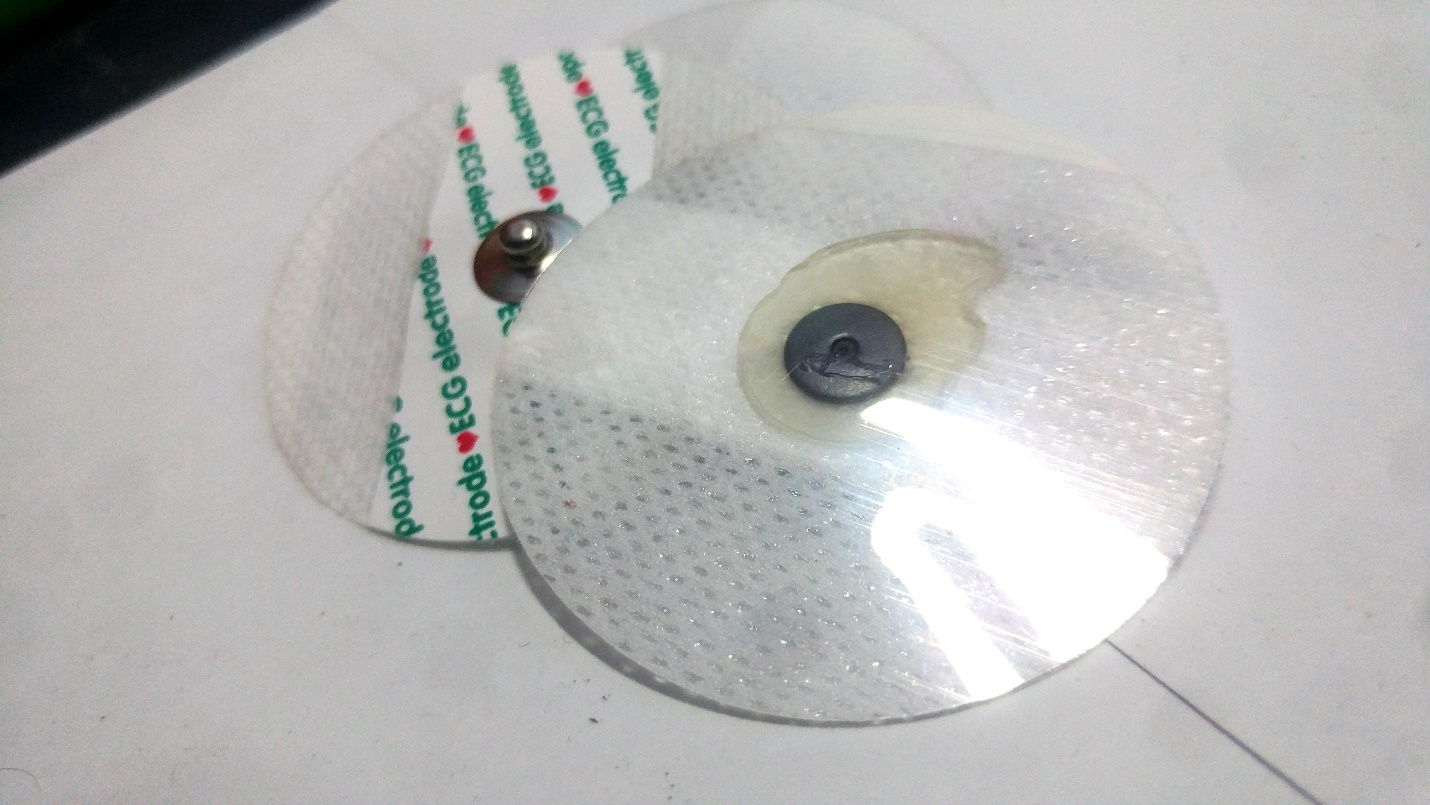
- ECG electrodes (3)
- ECG electrode connector - 3.5 mm
- Data Cable
- Jumper Wires
- Breadboard
AD8232 module by Sparkfun.
The hardware for our ECG heart monitor.
Required Software
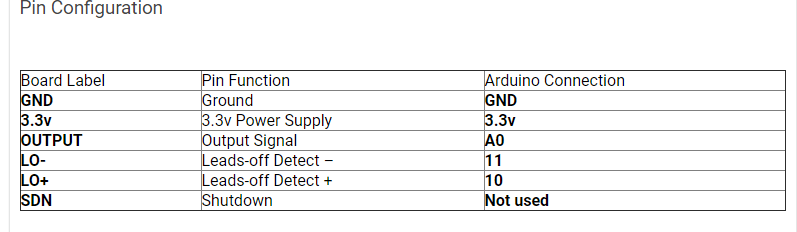
Wiring the AD8232 Module to Arduino UNO
Heart Rate Monitor Source Code
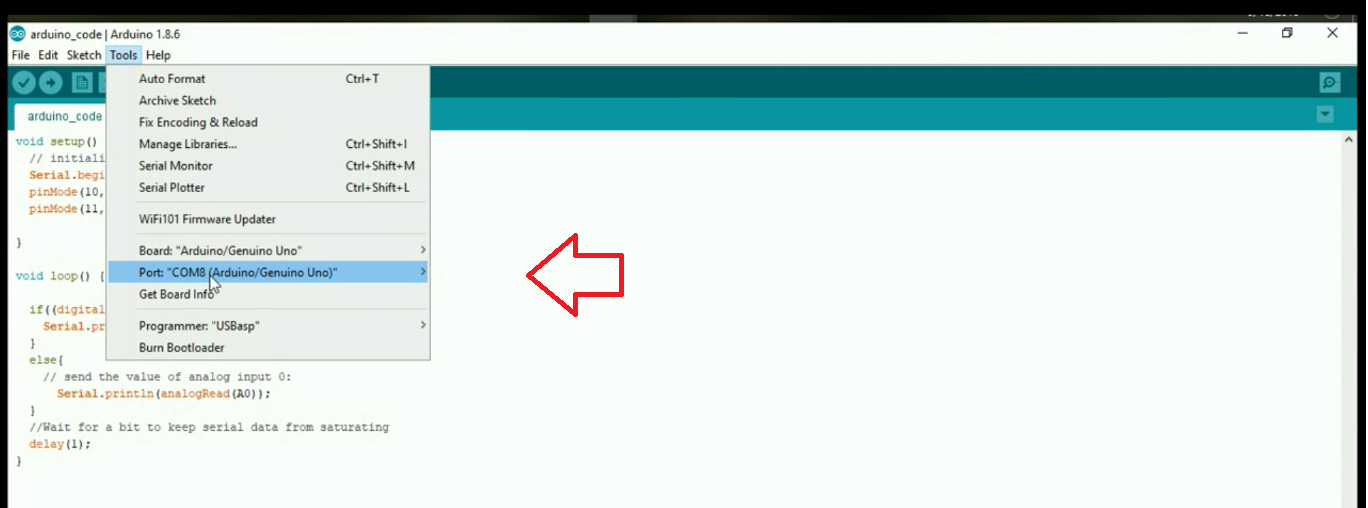
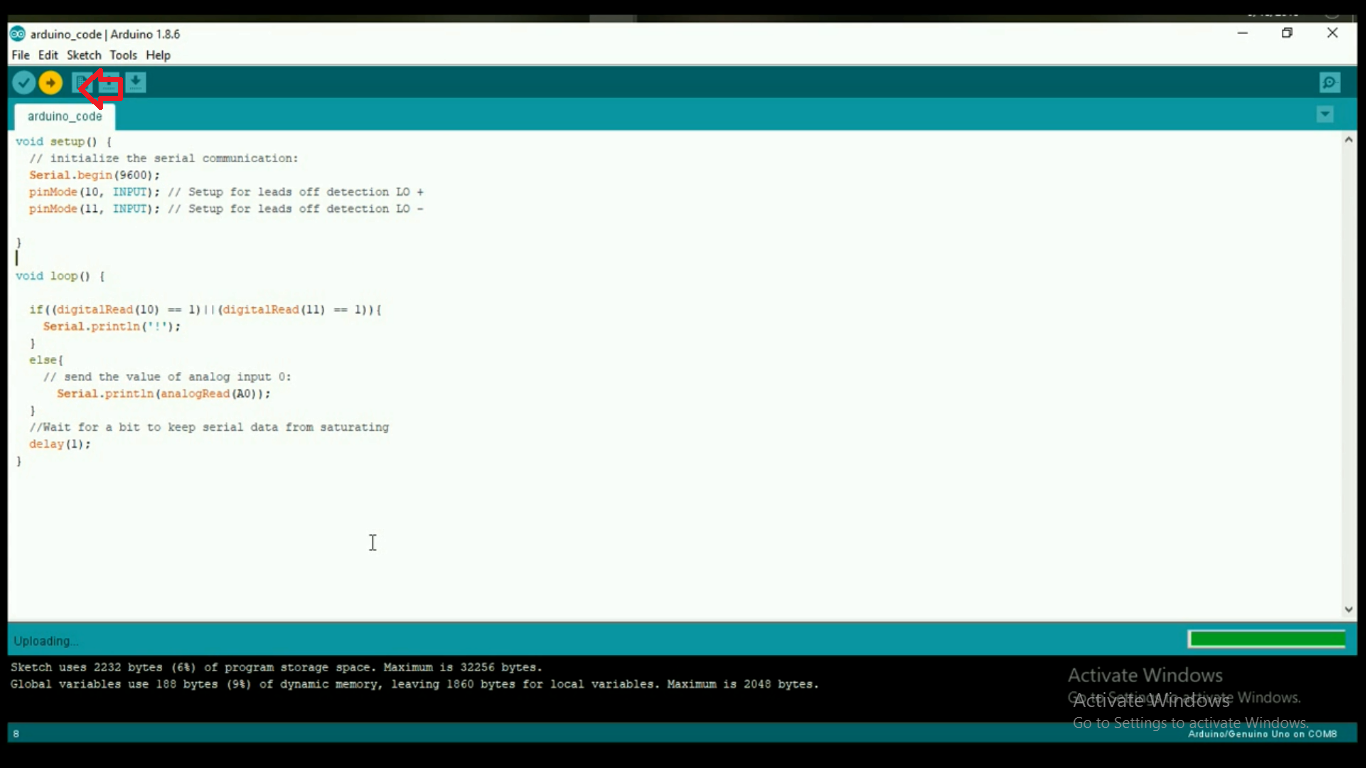
Download the .ino file or copy the below code and open it in the Arduino IDE. Connect the Arduino to your computer. Upload the code, and open the Serial Monitor:
void setup() {
   Serial.begin(9600);
  pinMode(10, INPUT); // Setup for leads off detection LO +
  pinMode(11, INPUT); // Setup for leads off detection LO -

}

void loop() {
  if((digitalRead(10) == 1)||(digitalRead(11) == 1)){
    Serial.println('!');
  }
  else{
     Serial.println(analogRead(A0));
  }
  delay(1);
}
Processing Code
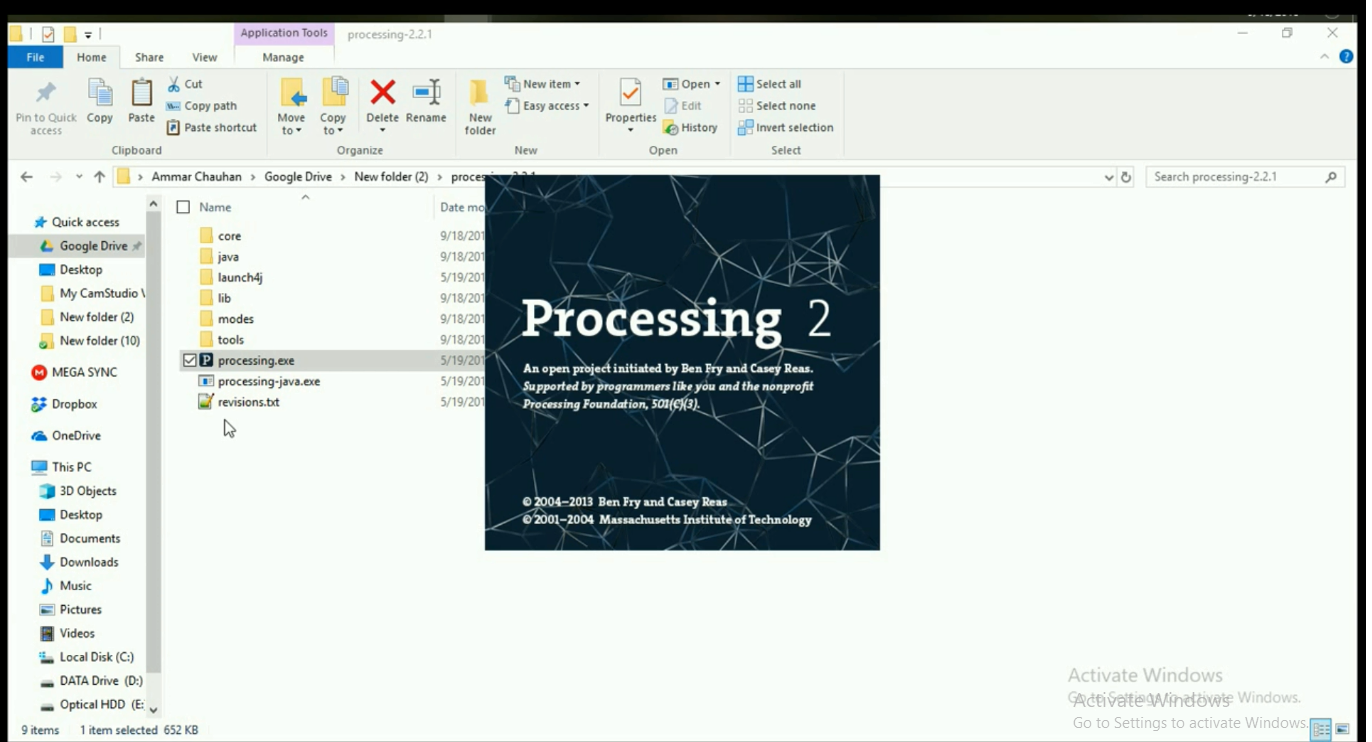
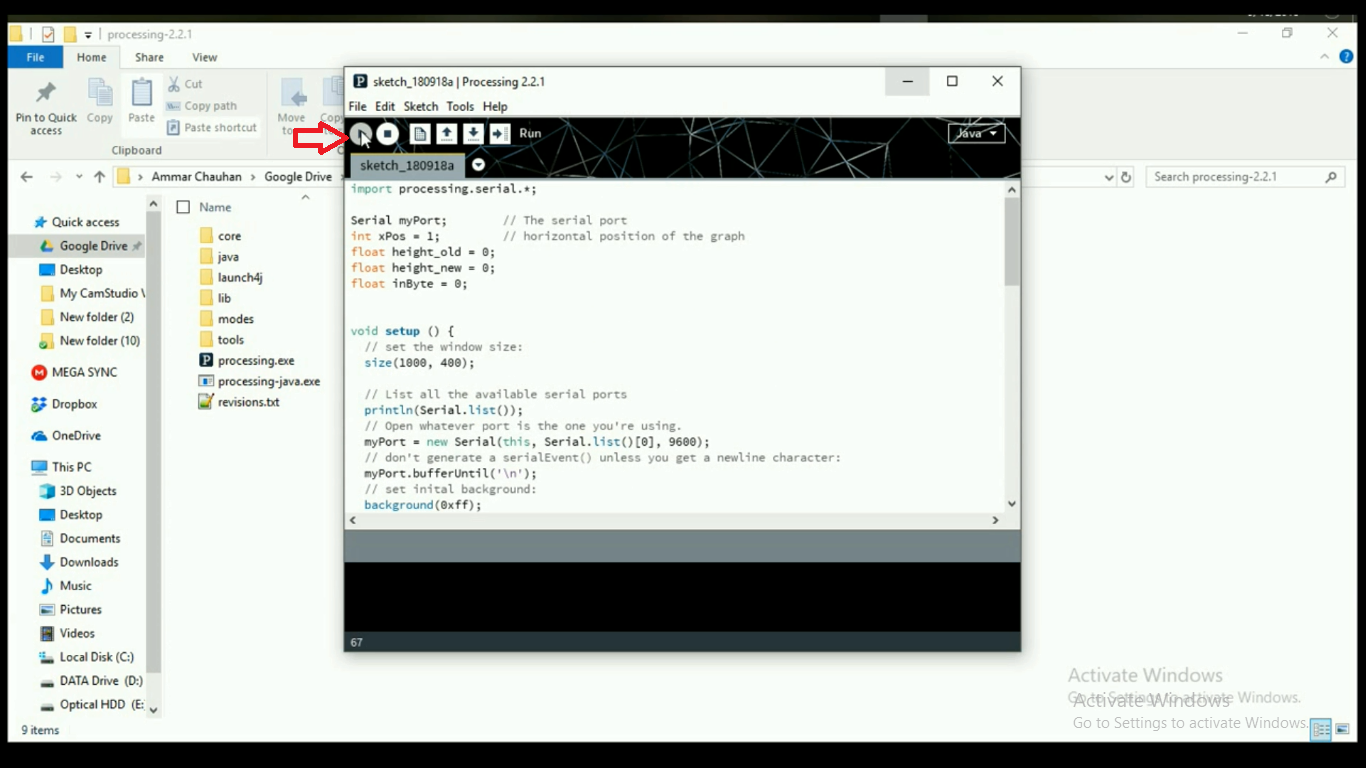
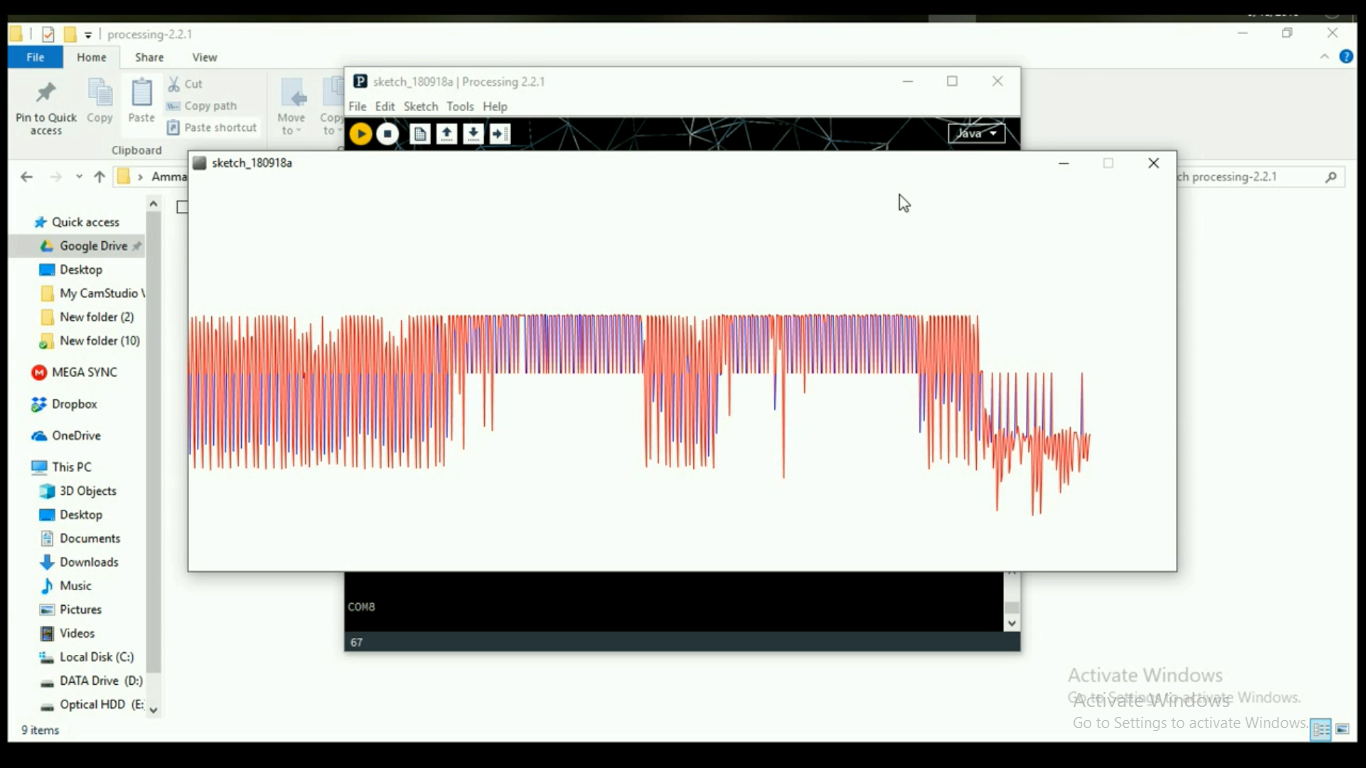
Run the Javascript given below in Processing in order to visualize the data. The data from the sensor is read by the Arduino and sent to the serial port. Processing reads this data from the serial port and then draws it out. Download the code below or just copy and paste it into your Processing IDE and click run.
**NOTE: Only Processing 2.2.1 works with this code.
import processing.serial.*;

Serial myPort;
int xPos = 1;
float height_old = 0;
float height_new = 0;
float inByte = 0;

void setup () {

  size(1000, 400);
  println(Serial.list());
  myPort = new Serial(this, Serial.list()[0], 9600);
  myPort.bufferUntil('\n');
  background(0xff);
}
void draw () {
}

void serialEvent (Serial myPort) {
  String inString = myPort.readStringUntil('\n');
  if (inString != null) {
    inString = trim(inString);
    if (inString.equals("!")) {
      stroke(0, 0, 0xff); //Set stroke to blue ( R, G, B)
      inByte = 512;  // middle of the ADC range (Flat Line)
    }

    else {
      stroke(0xff, 0, 0); //Set stroke to red ( R, G, B)
      inByte = float(inString);
     }

     inByte = map(inByte, 0, 1023, 0, height);
     height_new = height - inByte;
     line(xPos - 1, height_old, xPos, height_new);
     height_old = height_new;

      if (xPos >= width) {
        xPos = 0;
        background(0xff);
      }
      else {

        xPos++;
      }
  }
}
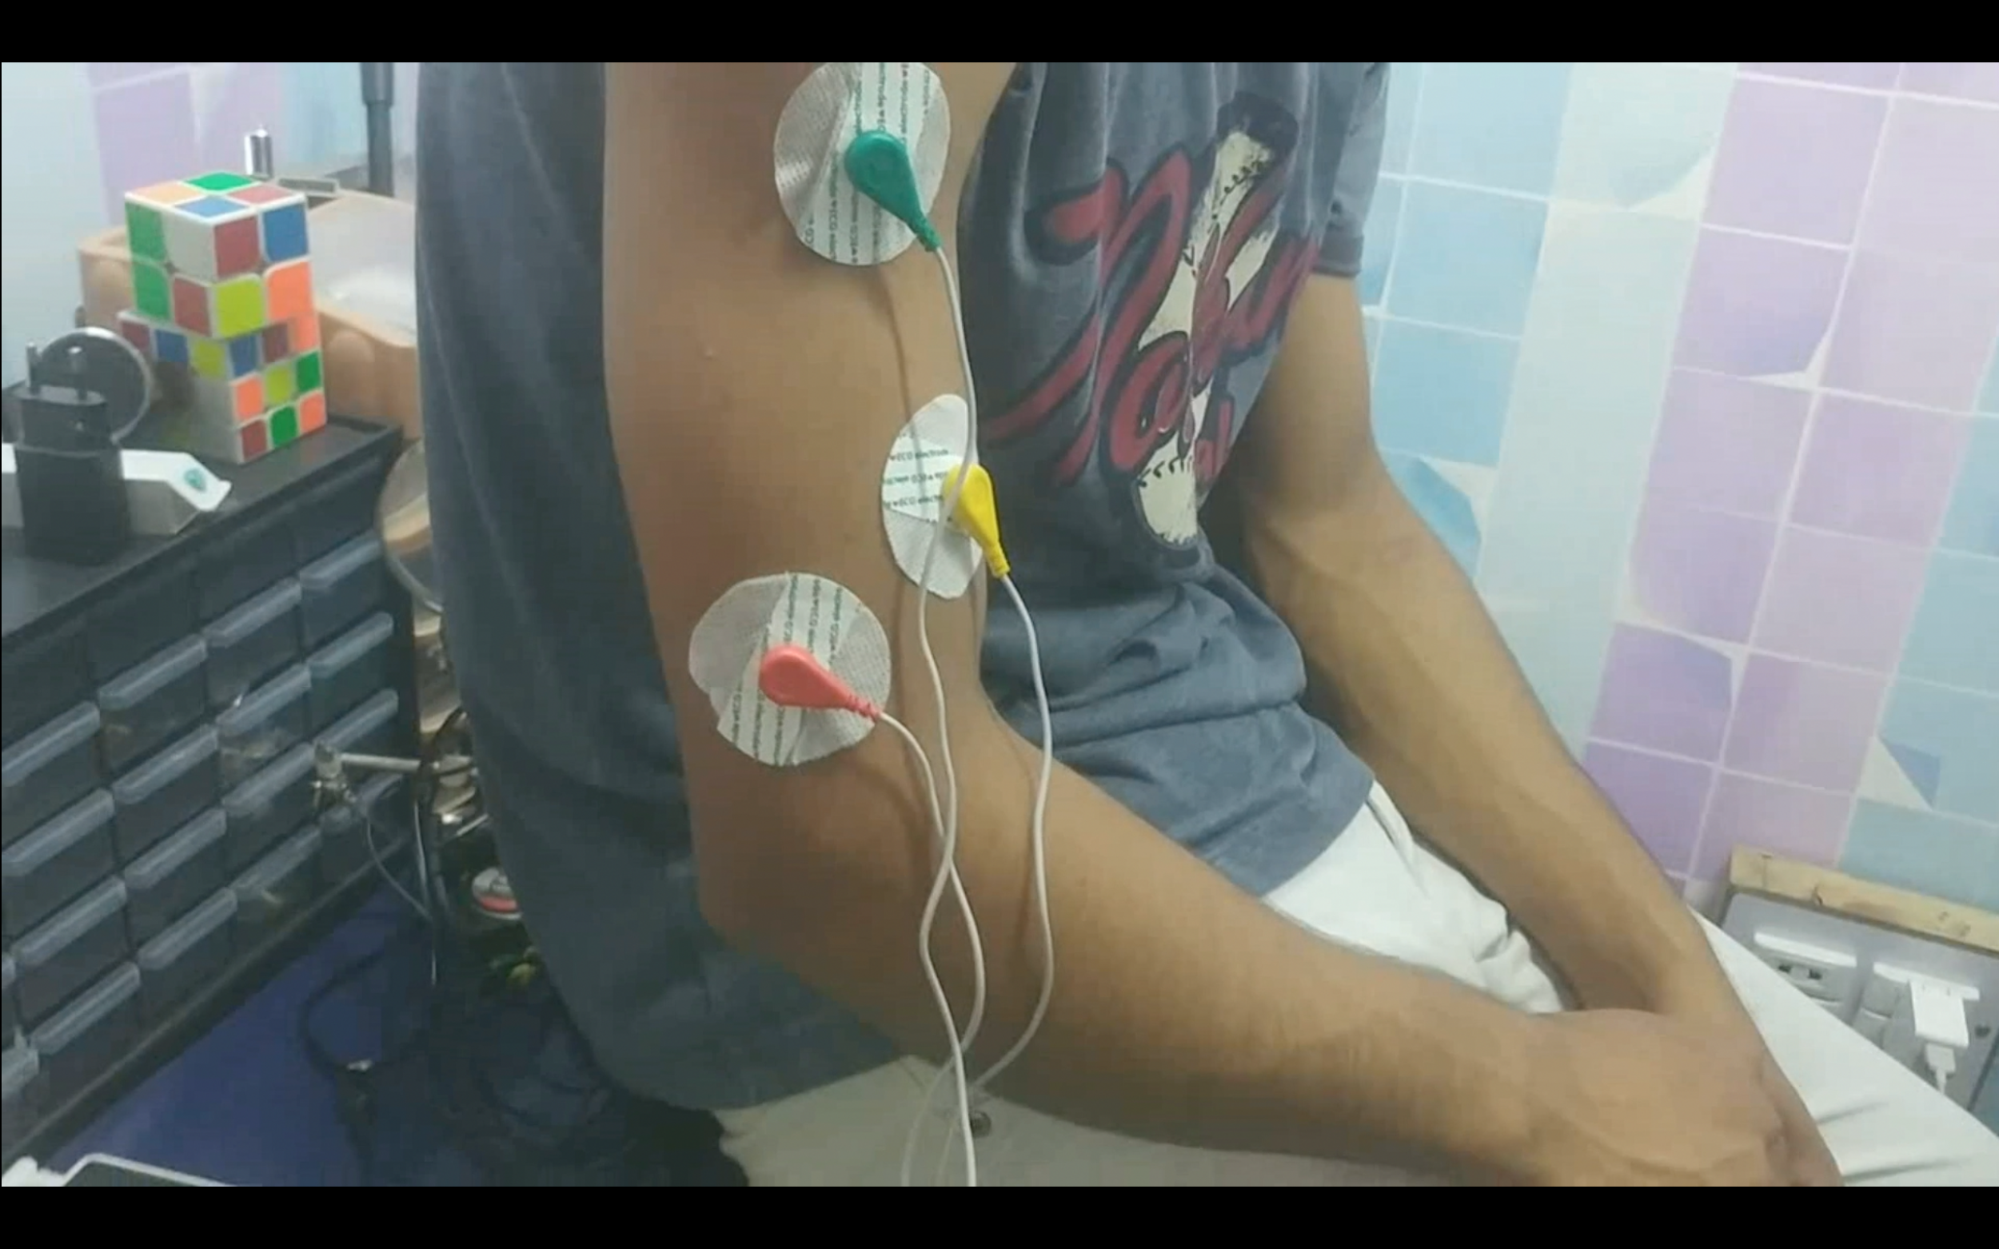
Make sure the three electrodes are placed either on your hand or your chest and attached properly.
Now you will be able to see the visualization of your heartbeat, and it will look like this: