It is not too late. You can start learning Internet of Things the fast track way. This tutorial helps you to quickly setup an IoT data-monitoring project in simple steps without using any extra hardware or software.
So, what about "Things" ?
When we say Internet of Things, we visualize vast network of sensors, microcontrollers, cloud services and data analysis platforms which is a bit scary for starters. So let's take it slow and in pieces.
You do not need to buy any hardware or development board (You have a smart phone right?).
You don't need any previous knowledge of IoT.Just an open and curious mind is more than enough (Since you are reading this article I believe you have).
Here, we are going to assemble a simple project using your smartphone as a "Thing" which sends some data to the internet. We will then monitor these data remotely through a computer through internet.
So, let’s get started:
Set up the mobile app
To make our smartphone share data over internet we need to install a nice little app called "Dweet My Phone".It's available for android and ios as well and requires no permission (except location).
"Dweet My Phone" app sends your smartphone location and other sensor data (like accelerometer and light sensor) to dweet.io.
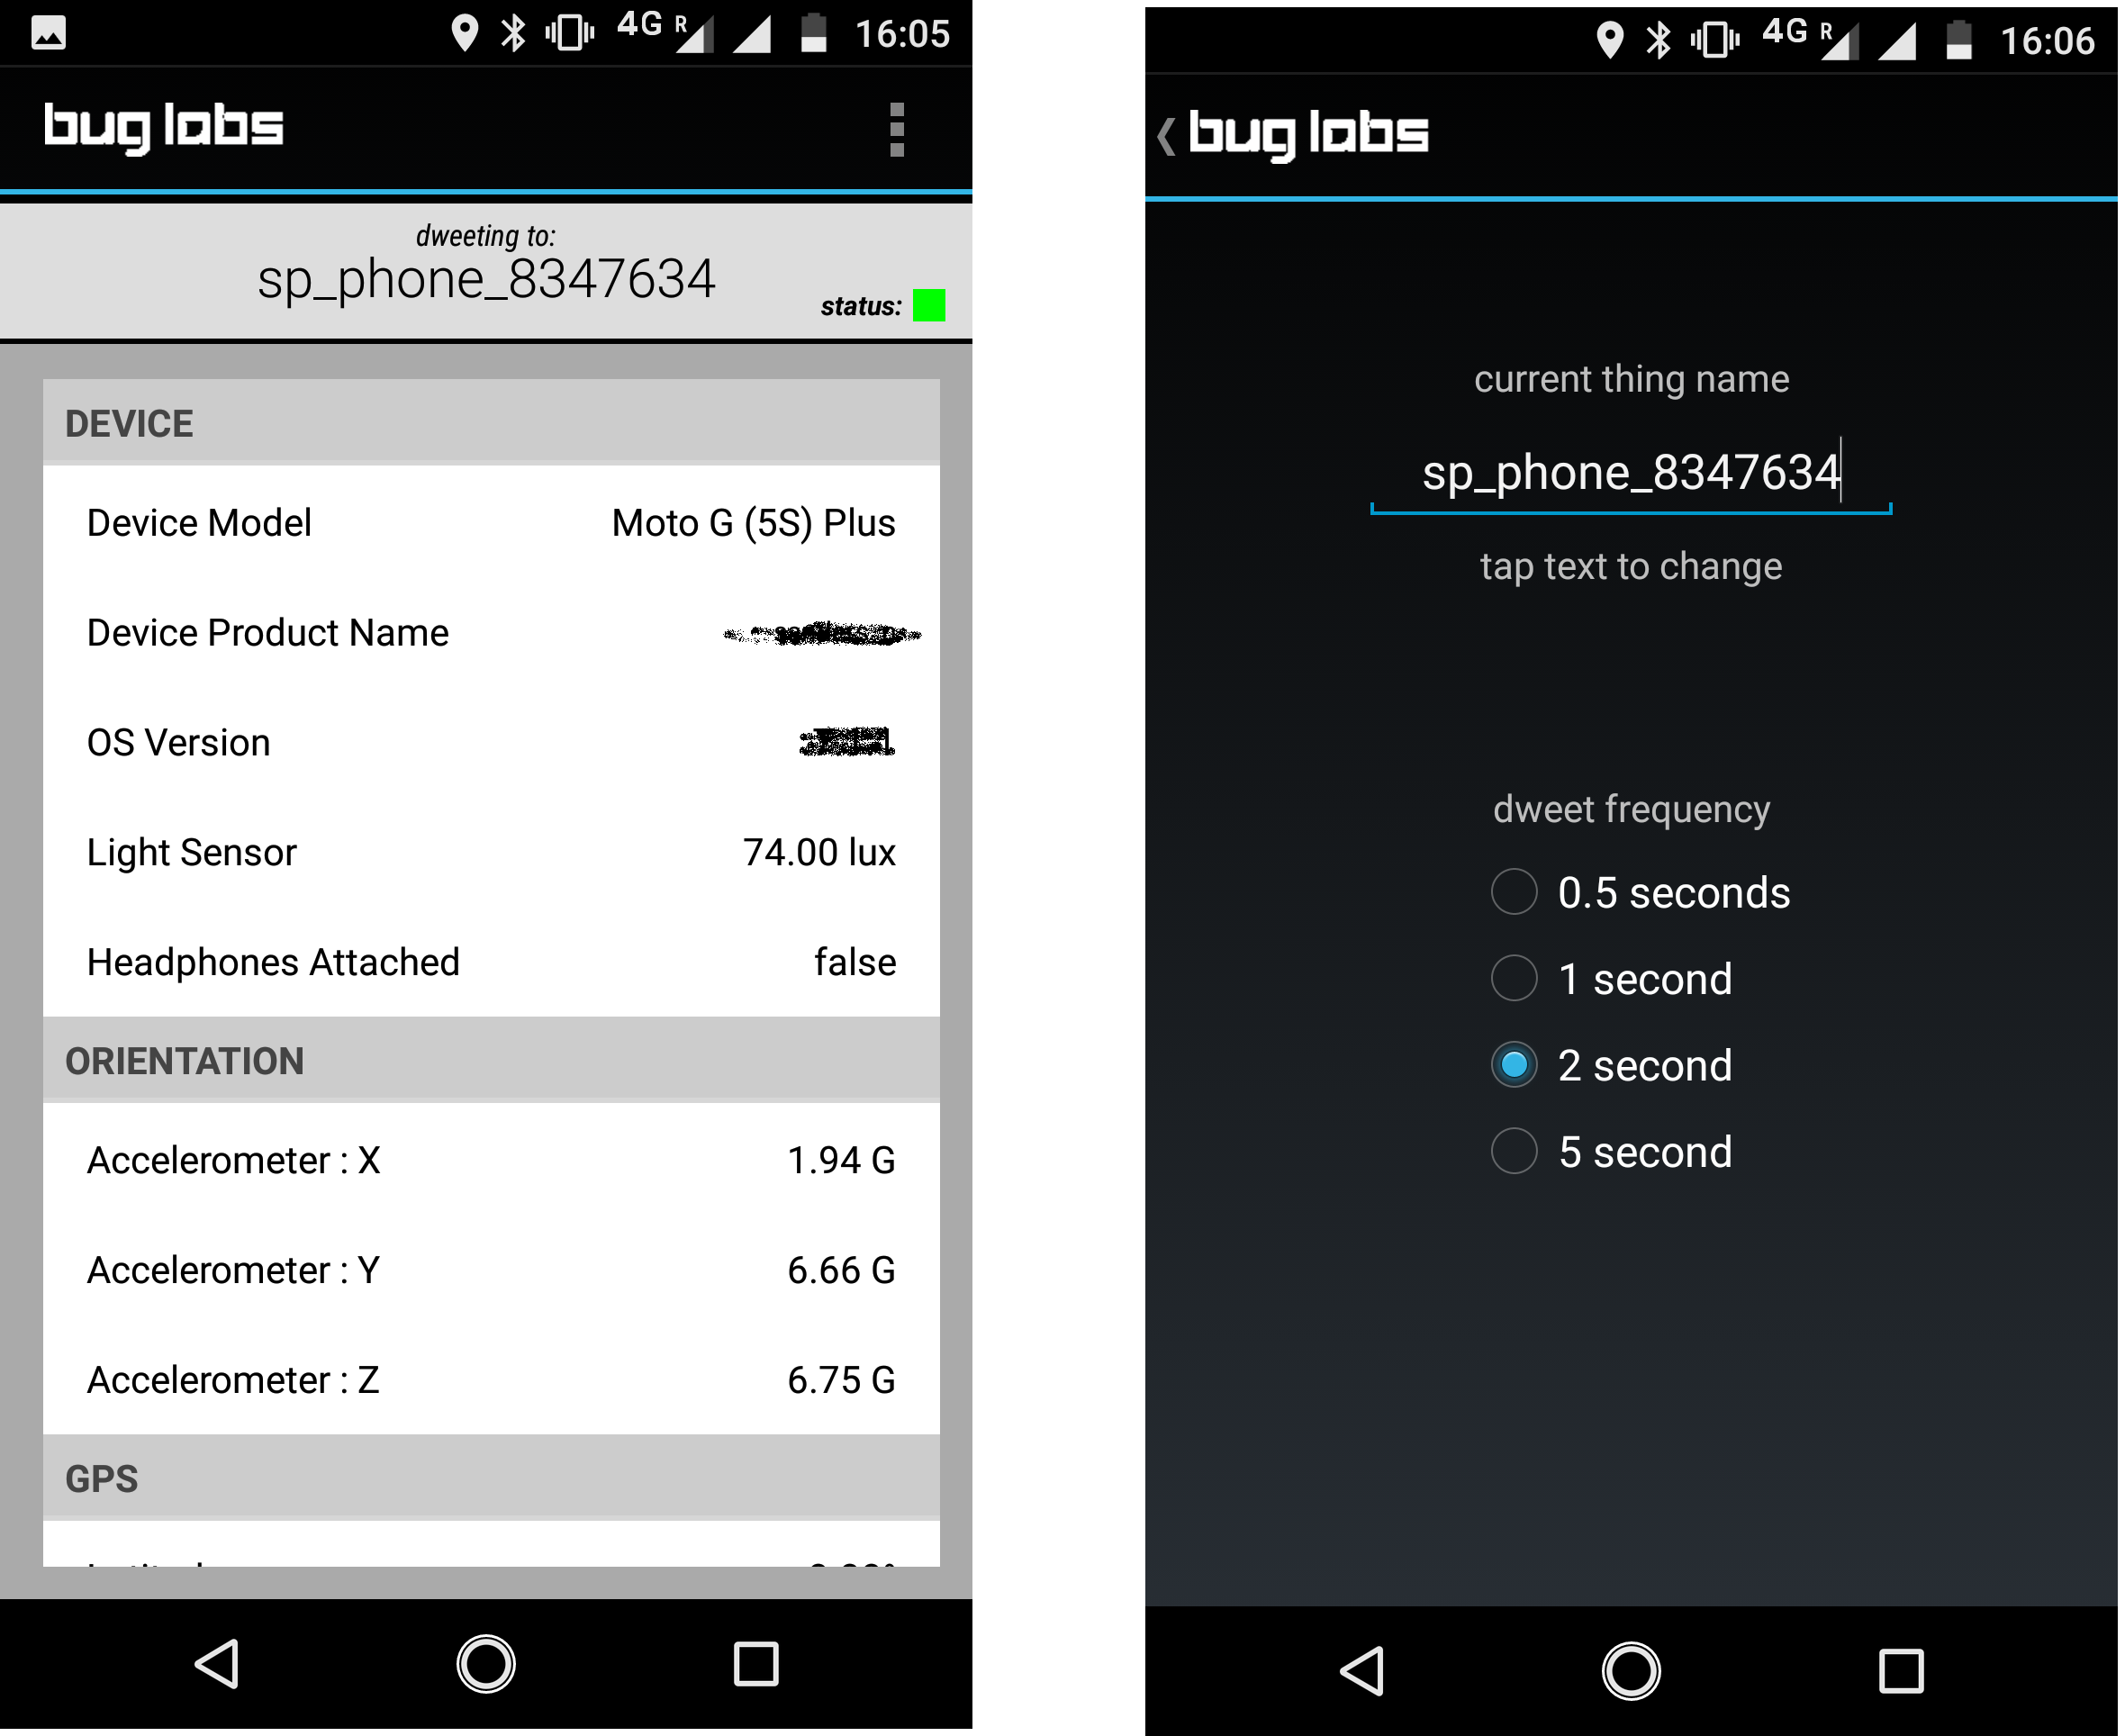
Once installed, open the app and go to the "dweet conf" option.
Figure 01: dweet app configuration
You can change the "current thing name" in the above screen. It is important to give it a unique name. So make it a mix of letters and random numbers that would be beyond anyone's guess and coincidence.
The "current thing name" is the name of your data stream you are sending through an internet gateway called dweet.io. If the thing name is predictable, there is a higher chance someone else may send data with the same name and over write our data.
"dweet frequency" is the rate at which we'll send our phone data so keep it as you like.
Set up the remote dashboard
Since we want to see all the data our phone sends through the app, we will set up a remote dashboard at freeboard.io.
At freeboard.io you can set up dashboards for your IoT devices for free (for 30 days).
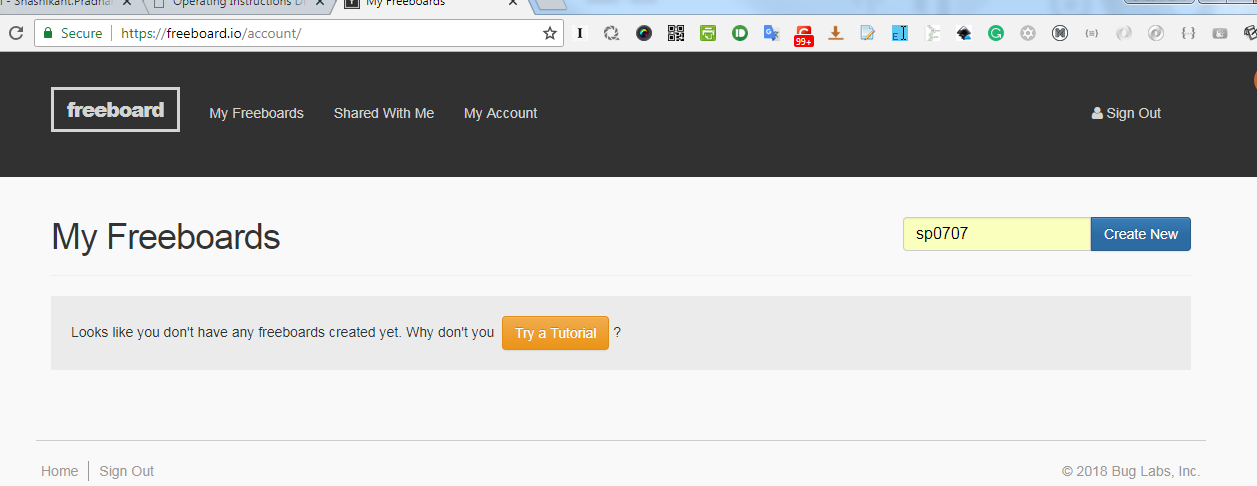
So go to the website freeboard.io and register
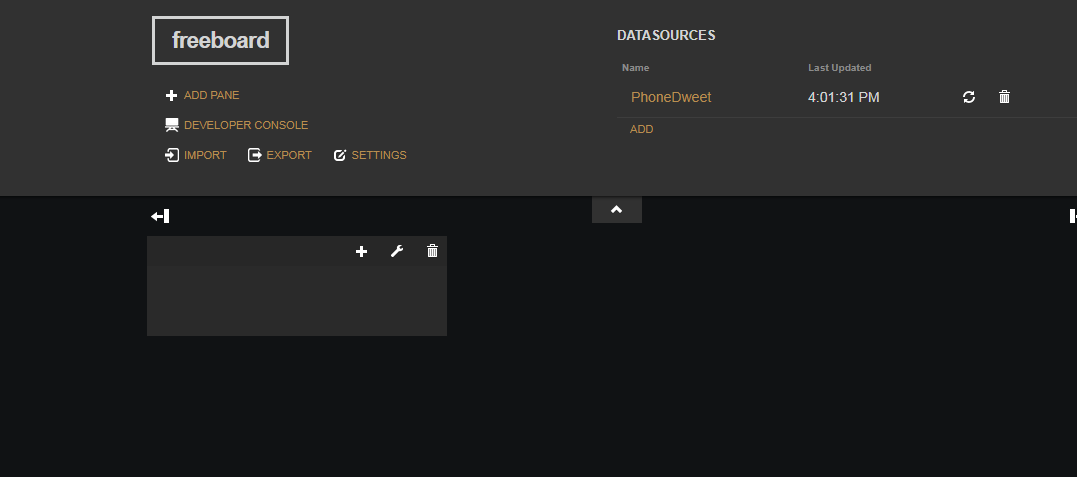
When you log in to the site, you will see a screen like this:
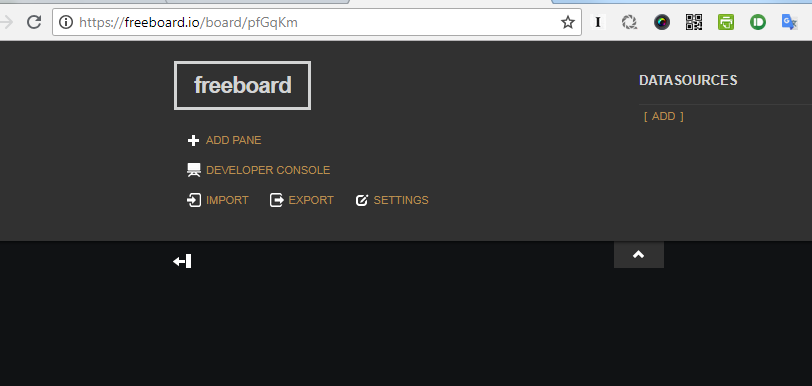
Add a new dashboard by giving a name to it and then clicking "Create New". Your new blank dashboard will open.
Next thing we will do it add a data source. We have installed the app on our phone to provide sensor data (like accelerometer) to our dashboard through internet.
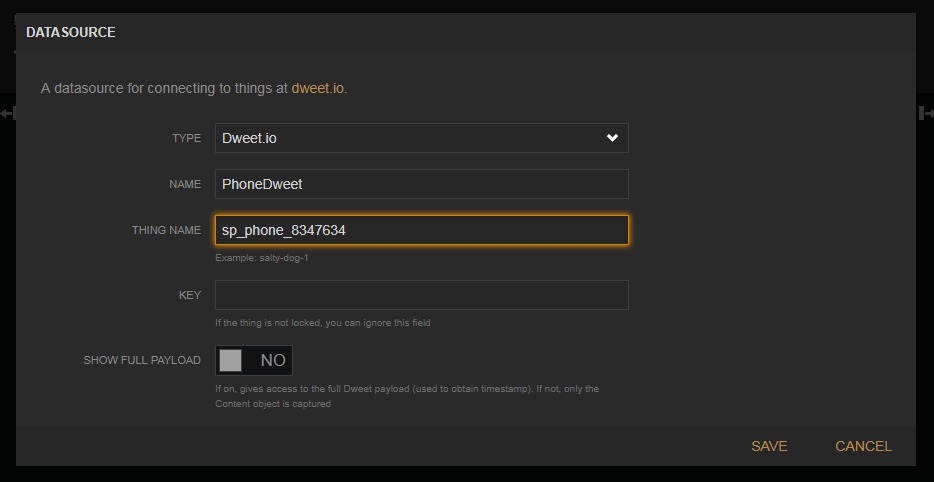
So, click on "ADD" under "DATASOURCES" on the window and then type in the following information as seen in the picture below.
"TYPE" is set to dweet.io since that is where we are sending our data.
"NAME" can be anything you like.
In the "THING NAME" box type in the name you have assigned in the "Dweet My Phone" app.
Click "SAVE" to complete the step.
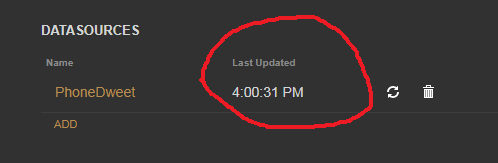
Once we have set the data source we can check if our data source is connected by checking the "LastUpdated" section on the dashboard (upper right corner of the page).
Now the next step is to add a Pane or container for our graphics by clicking "ADD PANE"
Then in the new Pane click "+" to add Widgets/graphics that can show our data. There are different types of Widgets to choose from like gauge, text, Google map etc.
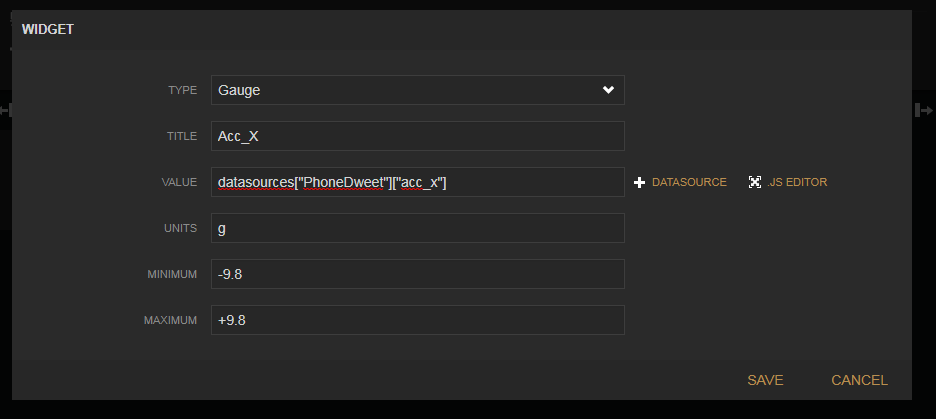
Here we will add the Gauge widget to capture the data from the phone accelerometer (acc x, acc y, acc z)
Therefore, in the widget popup fill in the necessary information as below for the Gauge widget.
Figure 07: Gauge widget configuration
In the "VALUE" box click on the "+DATASOURCE" on the right and you will be able to choose the specific data available in the incoming data source.
So we will create three gauges for monitoring the accelerometer data from our phone app and select the input data point accordingly.
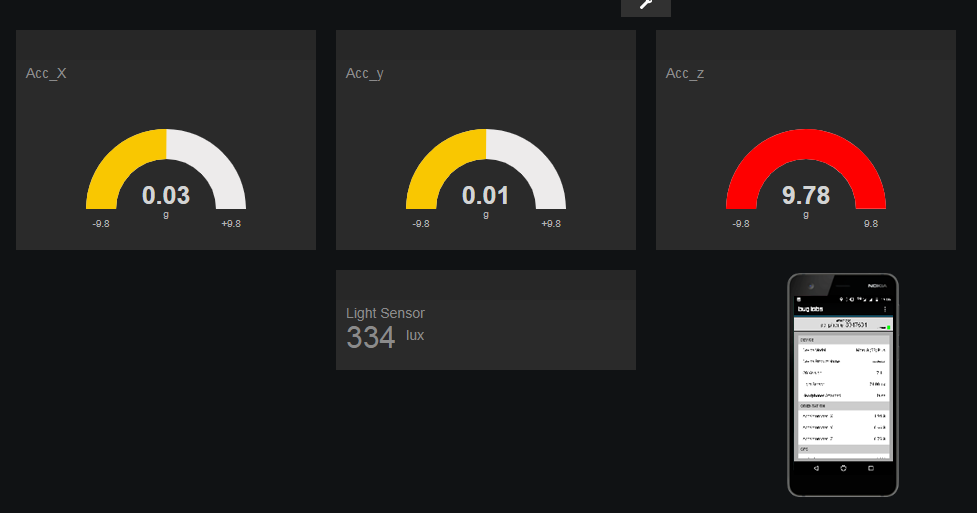
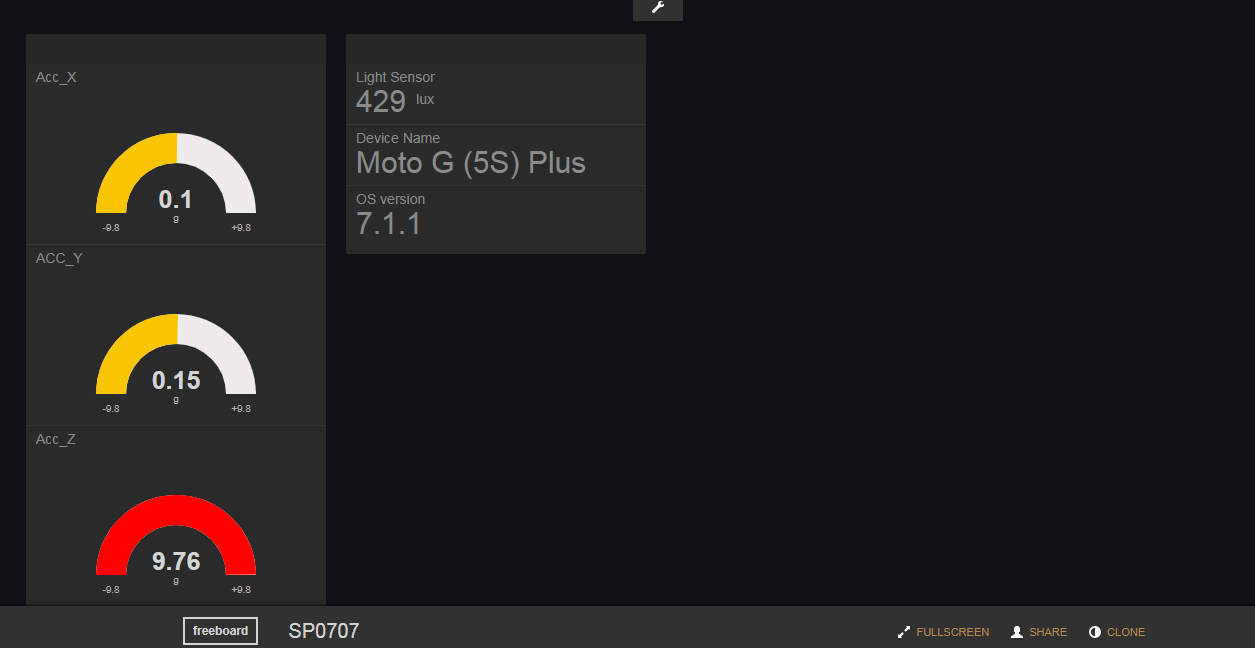
Once finished our dashboard is ready to show the data in the widgets
Open the app and tilt the phone in different angles. You will see the animated gauges showing the corresponding values of x, y and z axis values.
Figure 08: Working dashboard
It is possible to show other data that comes from our app like "Phone Name" or light sensor input using different widgets. You can experiment by adding different widgets to the dashboard like google map, which can show your phone’s live location. You can use it to track any mobile phone.
How does it work?
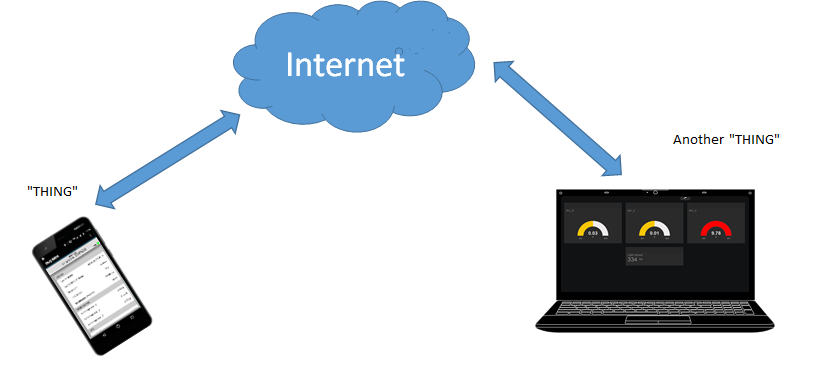
There are two components ("Things") here, the data source and the dashboard where we receive these data and monitor them.
The communication happens over the internet through a gateway called dweet.io.
dweet.io allows machines and sensors to send data which become easily accessible through a web based RESTful API, allowing you to quickly make apps to monitor the information.